The concept of seasonality is well-established in many industries, influencing the prices of goods and commodities based on annual cycles. From agricultural products to retail sales, businesses often anticipate and plan for seasonal fluctuations. But does this phenomenon also extend to the currency market? While some traders believe that currency values are unaffected by seasonal trends, others argue that there are indeed patterns to be observed.
In this article, we’ll delve into the debate surrounding seasonality in the Forex market. We’ll examine long-term historical data of major currency pairs to identify potential seasonal trends and explore the factors that may contribute to them.
Article content
Important Considerations for Forex Traders
At AMarkets, our goal is to empower our blog readers with knowledge that can enhance their trading strategies. With that in mind, here are a few key points to consider as you explore this article:
- The information presented in this article is based on popular theories and historical data analysis. While we respect the original authors of these ideas, our conclusions are our own professional interpretation. Our aim is to provide practical insights that can benefit your trading.
- Seasonality is most relevant to traders who employ long-term strategies. If you’re primarily focused on intraday trading or scalping, the information in this article may not be as directly applicable.
Hypothesis 1: The USD/JPY Pair Rises in October
This theory comes from a study conducted by a world-renowned currency analyst, Kathy Lien, for Investopedia. After analyzing decades of USD/JPY data, she claims that in 68% of cases, the pair ends October at a higher level than where it started. Let’s examine how this pattern played out in 2021-2023.
Chart 1. 2021
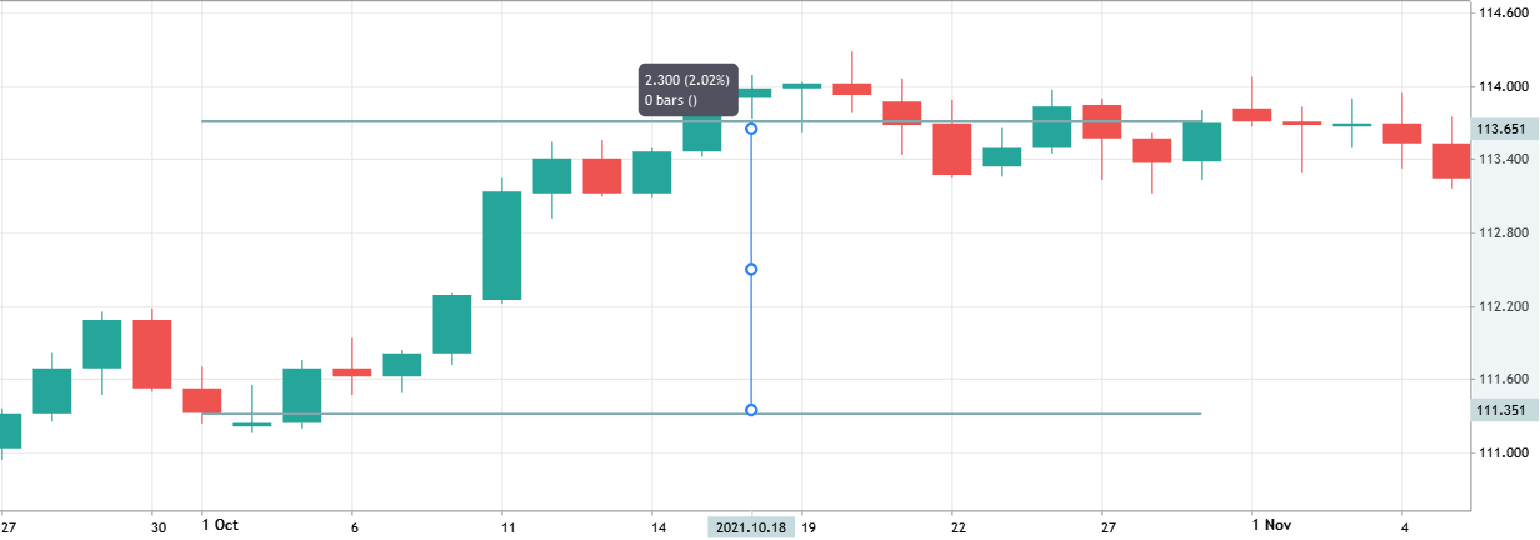
In 2021, October was indeed a positive month for USD/JPY, with a growth of about 2%. Notably, most of the gains occurred in the first two weeks, after which the pair consolidated below its peak, ending the month at that level.
Chart 2. 2022
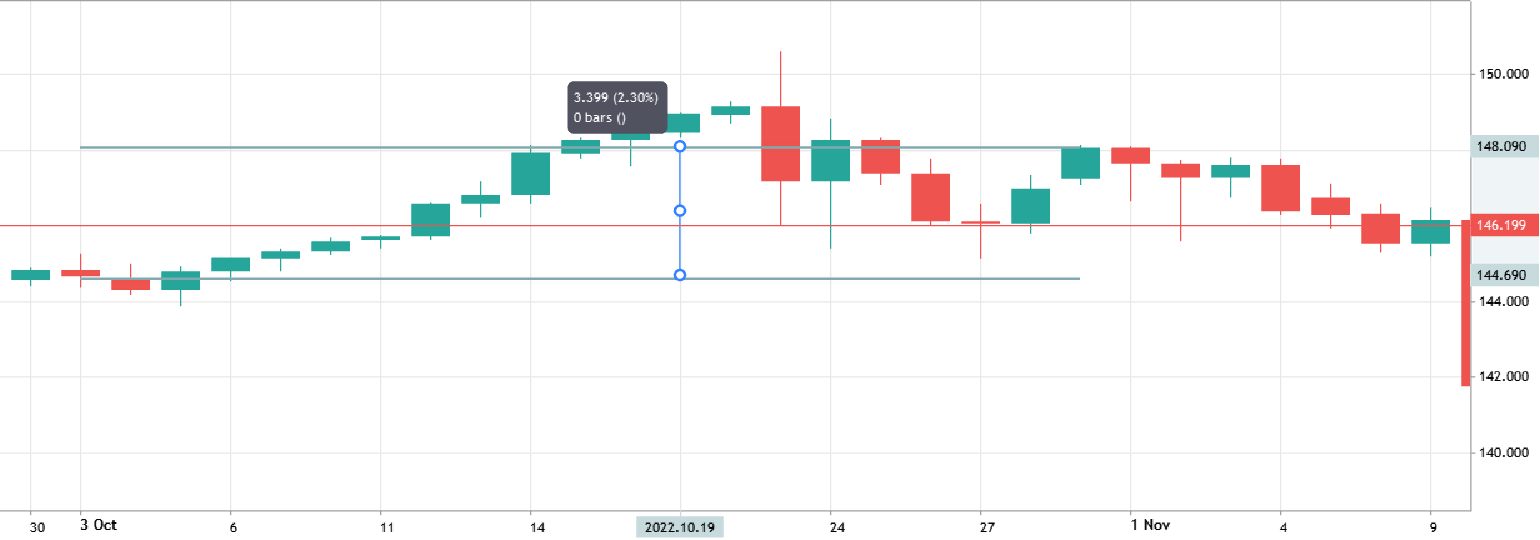
In 2022, the pair gained nearly 2.5%, again within the first two weeks. However, this was followed by a decline, bringing the pair close to where it started the month, with some recovery in the last two days.
Chart 3. 2023
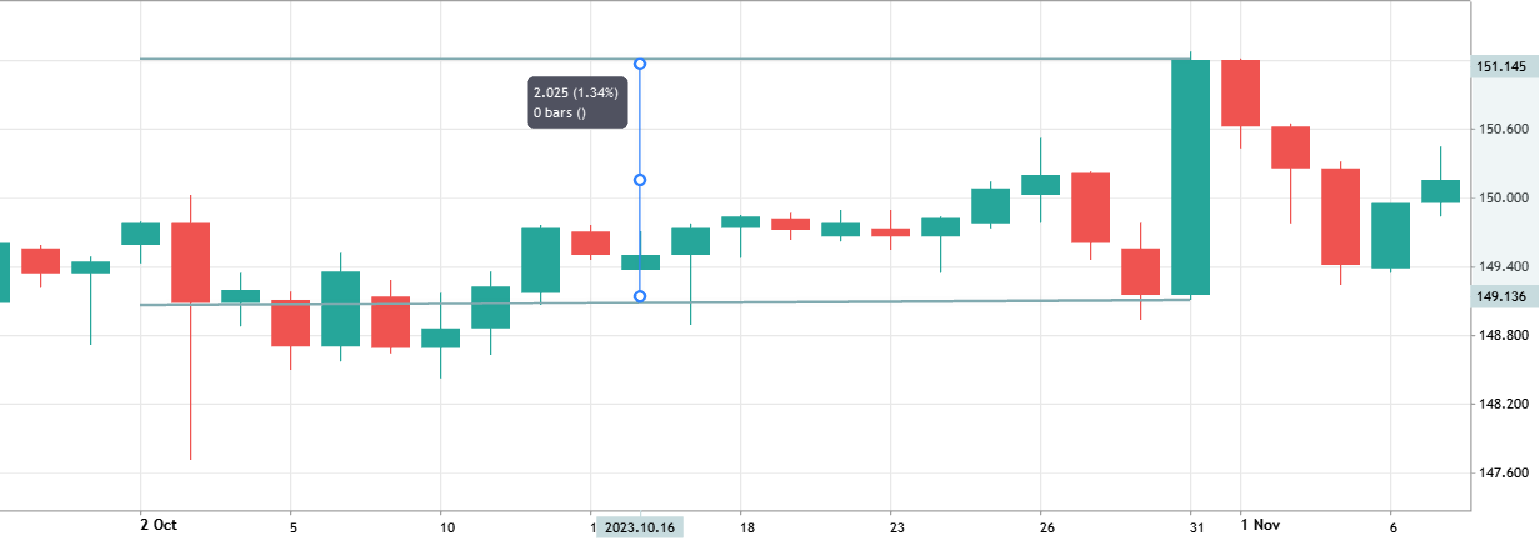
In October 2023, USD/JPY traded below its starting level for almost a third of the month. The pair saw some modest gains afterward, though most of October was a consolidation phase. A sharp rise on the final day of the month accounted for nearly all of its growth.
Hypothesis 2: January is Good for the Dollar
This theory is based on a comprehensive statistical analysis, showing that over the past 46 years, the US Dollar Index (DXY) has risen more often than it has fallen in January. Let’s take a look at a monthly chart in which we’ve highlighted DXY’s performance in January 2021-2023.
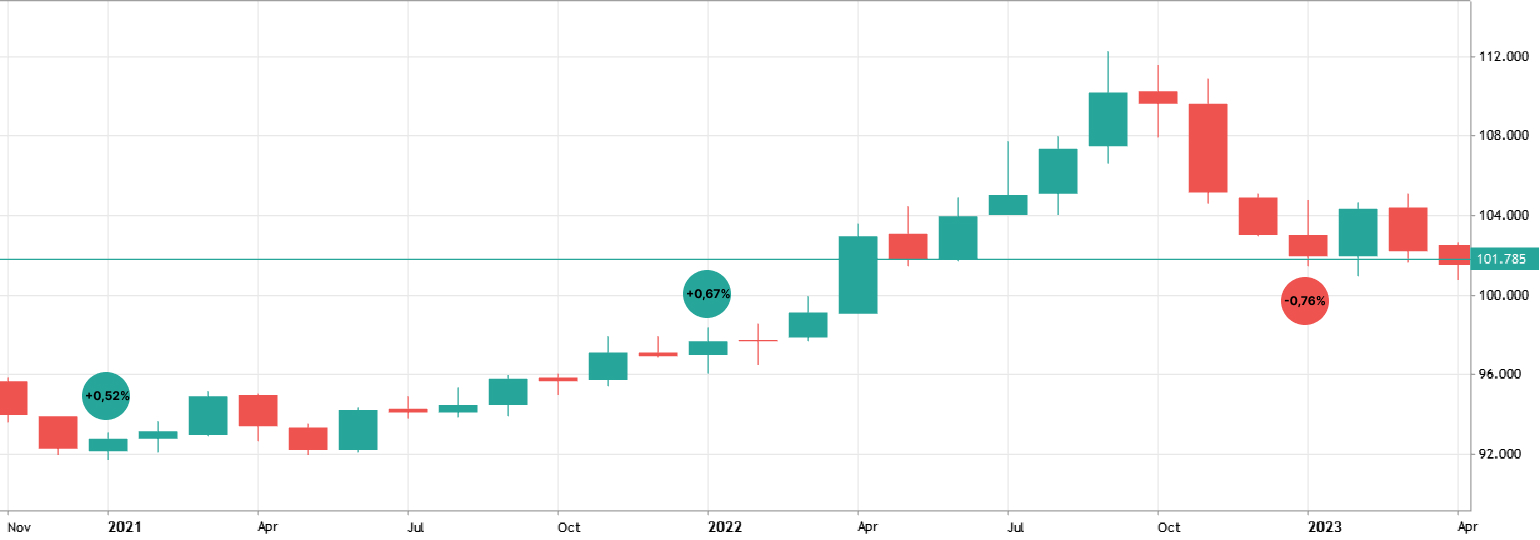
The results show that in two out of three cases, the index did rise. However, traders should note two key points. First, the increase was relatively small, around 0.5% for the month. Second, notice the long lower shadow on the candle in 2022, which indicates that the index experienced a significant drop during the month before recovering. Let’s zoom in on the daily chart for 2022.
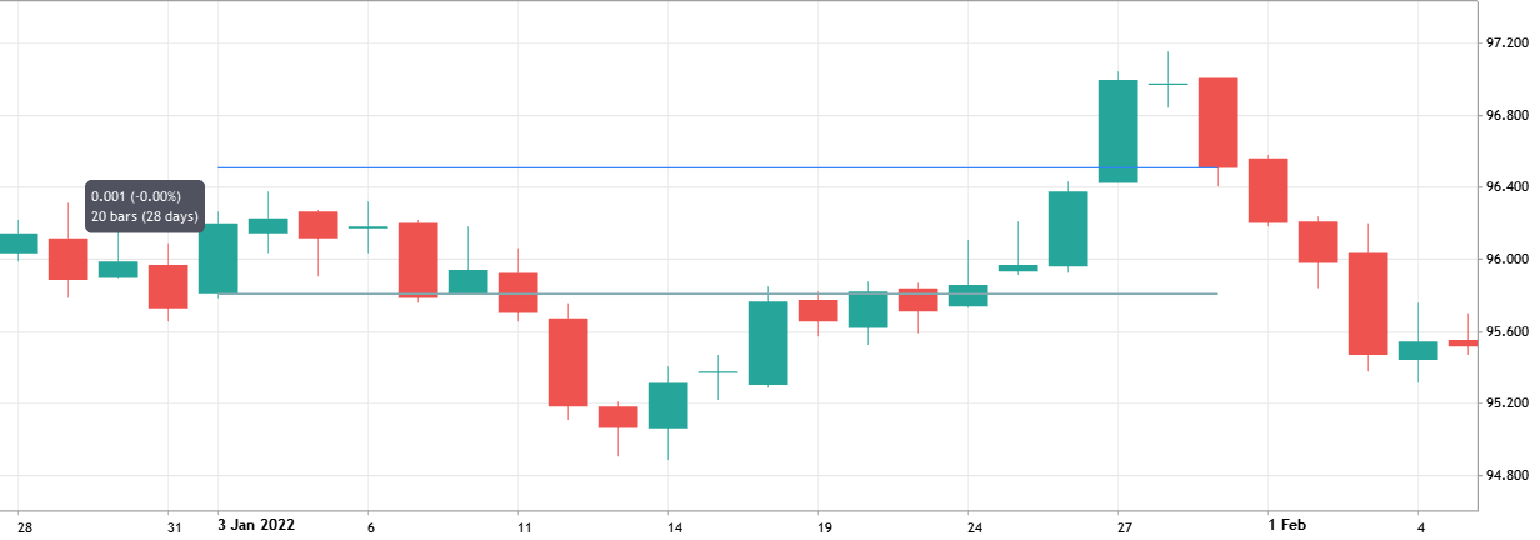
As you can see, in January 2022, the DXY closed below its starting level on nine out of 21 trading days, showing that despite an overall gain, there was significant volatility throughout the month.
Other Hypotheses and Conclusions
Many traders and analysts collect statistical data to help forecast market trends, leading to a growing number of seasonality-based hypotheses. For instance, some argue that the USD/CAD pair tends to fall in May, while others suggest that EUR/USD typically rises from March to December.
However, when you examine the charts of these or other currency pairs, you’ll likely find similar patterns to those shown earlier. These patterns lead to the following conclusions:
Any statistical analysis involves assumptions. Researchers often study a specific currency pair on a monthly timeframe, comparing results over many years. They record the number of up and down candles in a table. Statistically, it’s rare to see an exact 50/50 split. But this doesn’t guarantee that the results will apply to the current year.
In the charts above, you’ve seen that even when a currency pair moves in the direction predicted by hypotheses, its path is often more complex than a simple, one-way trend. Therefore, using seasonality in Forex should be approached with caution, if at all. It shouldn’t replace technical and fundamental analysis.