Technical analysis is a way to analyze the Forex market by looking at price charts. However, it’s not a single approach. It’s complex and includes many different methods, all aimed at understanding what’s happening with a currency pair and predicting its future movement. One of these methods is called “multi-timeframe analysis,” and today, we’ll explain why every beginner trader should consider it.
Article content
What Is It About?
This concept is quite straightforward. The price of each instrument can be viewed on charts with different time intervals. These aren’t about chart types (candlestick, line, bar) but rather the time each candle represents. They can vary greatly, from 1 minute to 1 month. It stands to reason that charts on different timeframes will also look different, even though the current value of the asset remains unchanged. In our example below (Fig. 1 and Fig. 2), we have two charts of the EUR/USD pair on the monthly and minute timeframes, respectively.
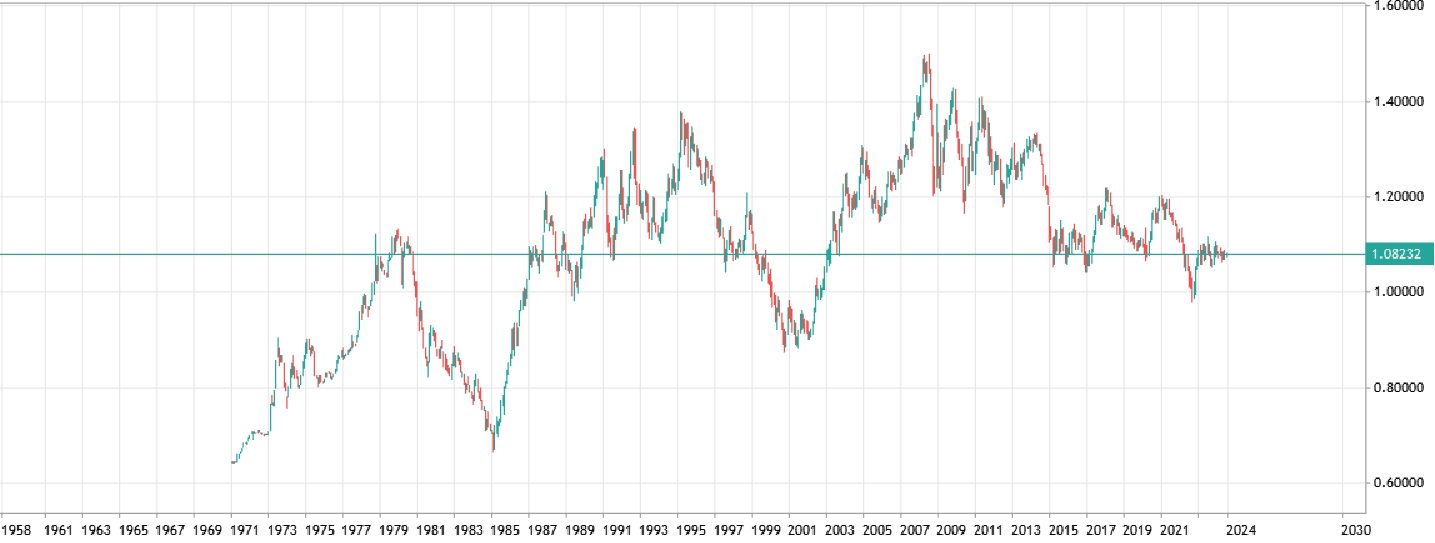 Fig. 1
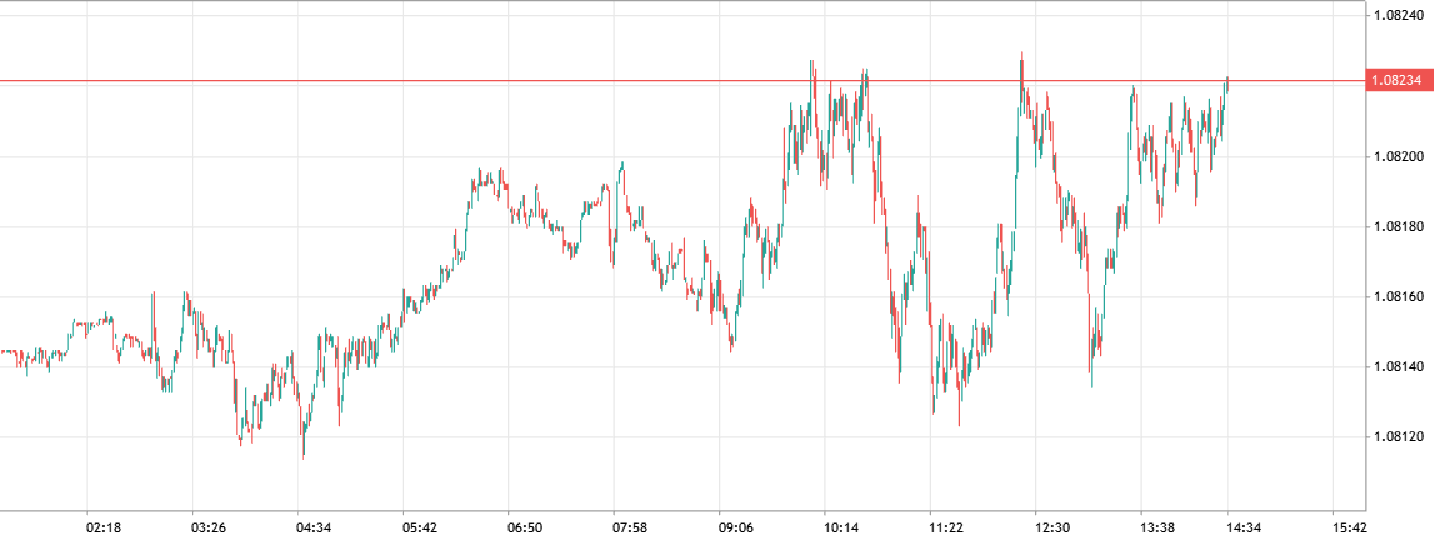 Fig. 2
Timeframes and Trading Psychology
You might think that since the price is the same, the timeframe you trade on doesn’t matter. However, most traders quickly develop a preference for a specific timeframe. This depends on your individual trading style and risk tolerance. After all, what do you get from a chart? Signals to buy and sell an asset and general information about market conditions, such as trends (upward, downward, or sideways), reversal or consolidation.
Many beginners are drawn to very short timeframes, like 1 minute to 15 minutes. This is because these charts seem to offer more signals and, therefore, more chances to make money. Unfortunately, it’s not that simple. Short-term charts can be misleading. To avoid this, multi-timeframe analysis comes in handy. Let’s look at some examples.
Multi-Timeframe Analysis in Practice
Let’s look at two charts. They’re very simple, even without any lines drawn on them. Take a look at this first chart (Fig. 3) and tell yourself what’s happening in the market right now.
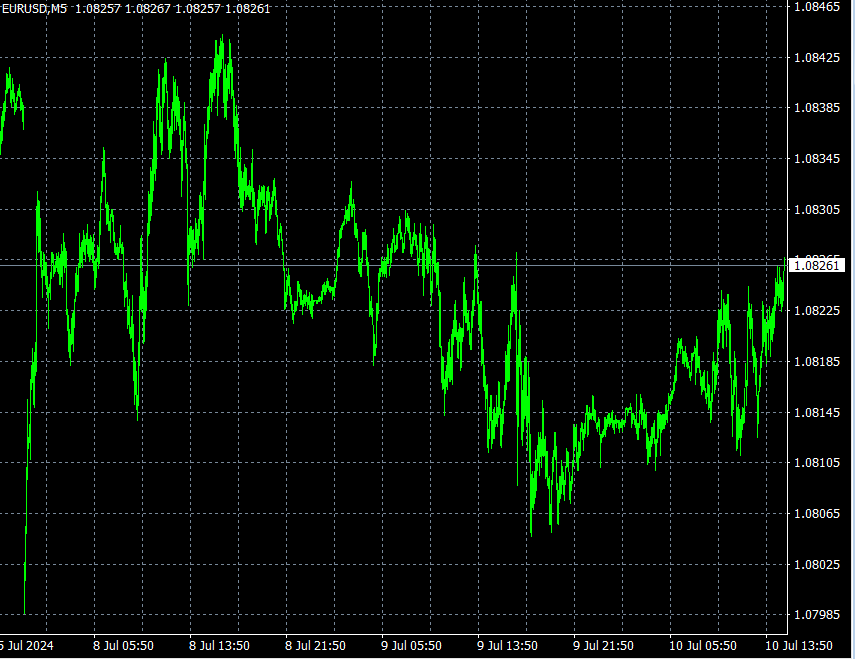 Fig. 3
Most likely, you see consolidation after a short downtrend. Now look at the next chart (Fig. 4).
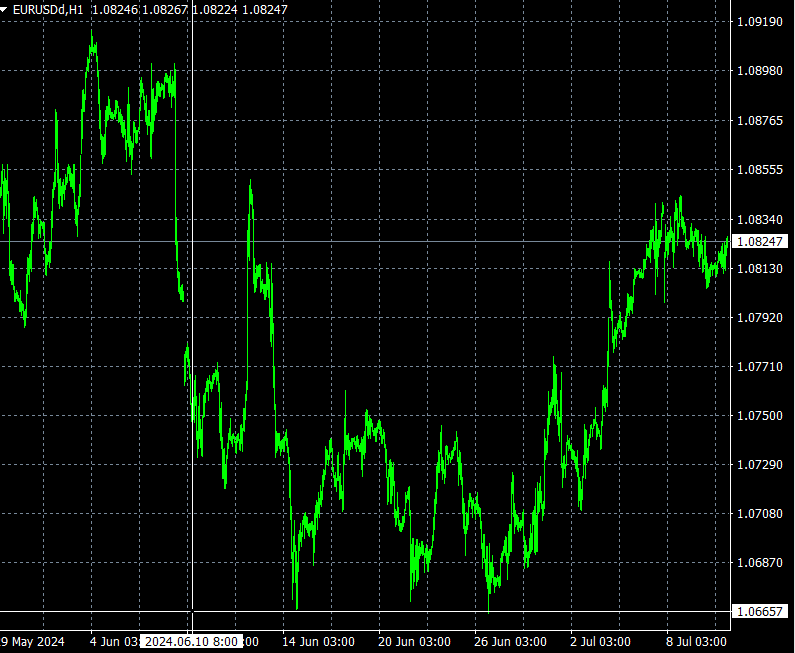 Fig. 4
Completely different, right? Here we see a strong uptrend, possibly with temporary consolidation now, but with a good chance of continuing higher. Of course, in real trading, we wouldn’t rely solely on eyeballing the charts. We use technical indicators, candlestick analysis, and consider trading volume. This isn’t meant to be a trading strategy. We just want you to see how different charts of the same instrument can look.
These charts are both for the EUR/USD pair, but on different timeframes. The first chart is a five-minute timeframe (Fig. 3), and the second is hourly (Fig. 4). Now, imagine you only had the first chart. It seems like the price might be breaking a resistance level after a period of flat movement. This could lead some traders to open a sell position (go short) and see where the price goes in the next few hours.
However, the hourly chart paints a completely opposite picture, showing a clear uptrend. If we looked at even larger timeframes, we might find the uptrend confirmed. By the way, this is what a trader’s workspace might look like when they consider all the aspects of multi-timeframe analysis.
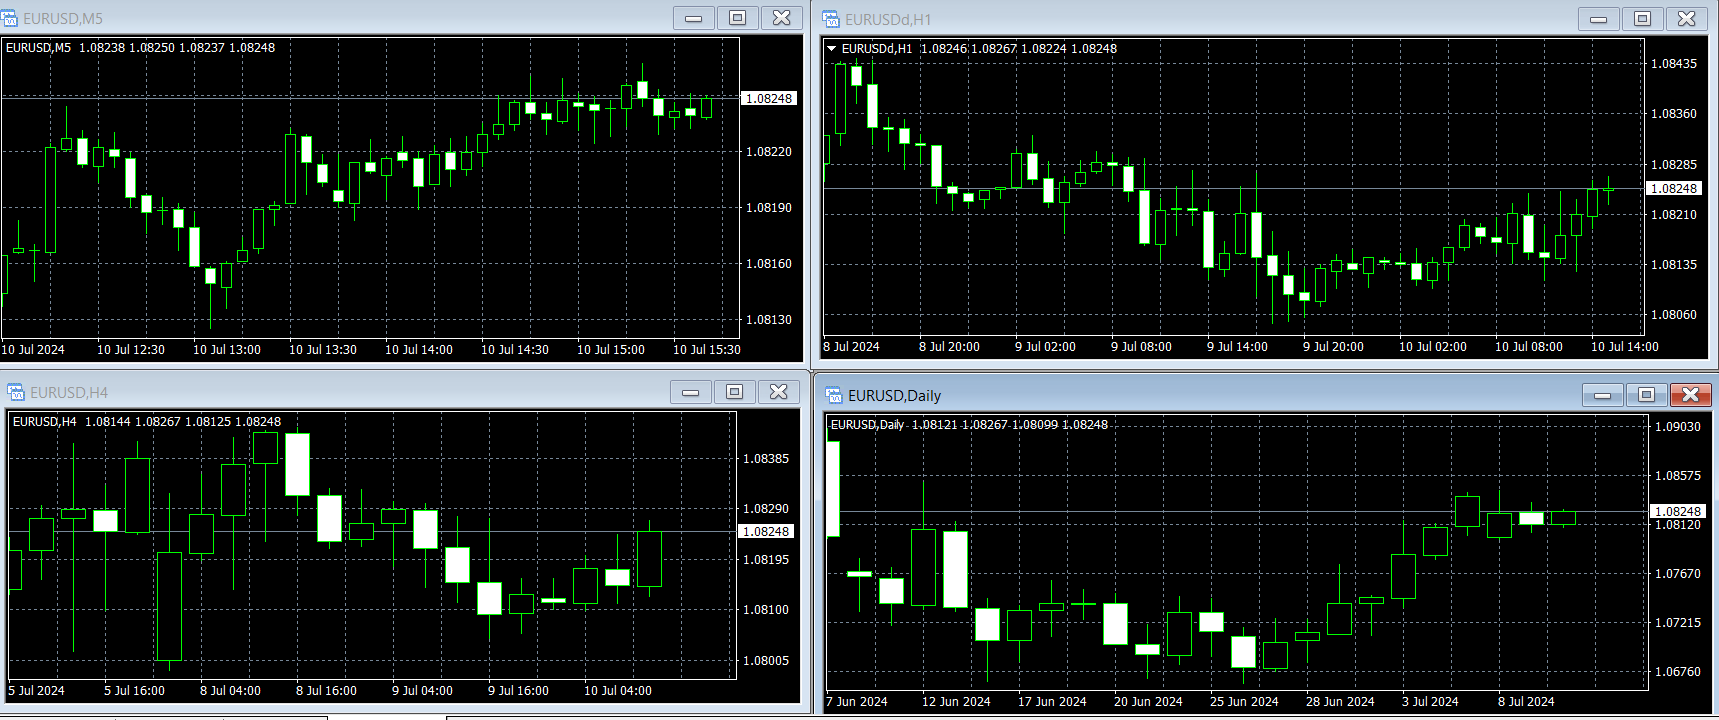 Fig. 5
Let’s reiterate: Making a trade without considering the bigger picture is not recommended. These examples simply show how important it is to get signals from different timeframes. Otherwise, you risk missing the real trend behind temporary price movements.
Conclusions
Every trader chooses a timeframe that suits their comfort level and trading style. The choice is often more about psychology than complex math – some traders prefer the fast pace of short timeframes with more signals, while others prefer the slower pace of longer timeframes.
But no matter your preference, it’s critical to assess the reliability of each trading signal before placing a trade. Multi-timeframe analysis, along with technical indicators, volume data, and important news, helps you see a more complete picture of what’s happening in the market. This leads to better-informed and ultimately more successful trading decisions.