In the world of Forex, the forces of supply and demand dictate price movements. But what drives these forces? Beyond the obvious economic and political factors, market sentiment plays a crucial role. Some traders focus not on fundamental or technical analysis but on sentiment analysis – an approach that seeks to understand the emotions and attitudes of market participants. Let’s explore how this method works and how you can use it in your trading.
Article content
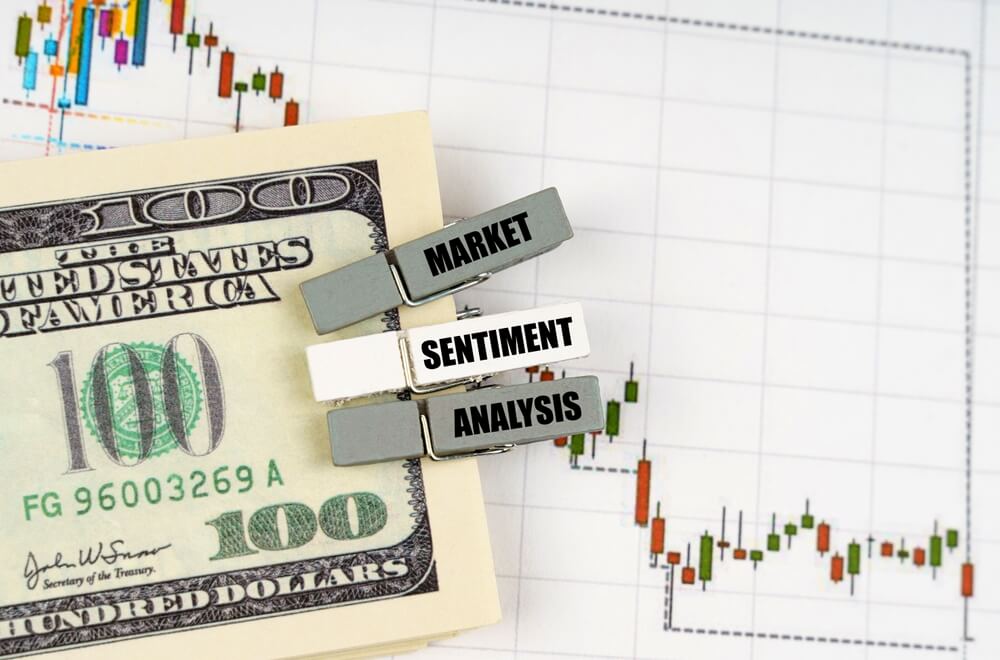
What is Sentiment Analysis?
Sentiment analysis aims to gauge the emotions and opinions of the strongest groups of buyers and sellers at any given time. The idea is that these emotions can significantly influence supply and demand, thereby affecting the prices of trading instruments. By understanding market sentiment, traders can better predict price movements.
Key Tools for Sentiment Analysis
- Sentiment Indicator: This indicator tracks the balance between buyers and sellers for each asset. When the percentage of either buyers or sellers exceeds 70%, it suggests that the market might be overbought or oversold. In such situations, the market is likely to move in the direction where there are fewer traders (30% or less), as this is typically the path of least resistance. Keep in mind that Forex traders can only see data from their own broker, not the whole market. While access to precise data on buyers and sellers in the Forex market is limited, traders can still obtain valuable insights from their brokers.
- Fear and Greed Index: Developed by CNN, this index measures the emotional mood of the market, showing how much fear and greed traders are feeling. It analyzes factors like stock market volatility, put-call ratios, and investor surveys to determine the overall market mood. Traders often use this tool to make better decisions, and it’s updated regularly on CNN’s website.
- VIX Index: Often referred to as the “fear index,” the VIX gauges expected volatility in the U.S. stock market by examining S&P 500 options. For Forex traders, the VIX is especially crucial as it reflects market sentiment and future volatility expectations. A rising VIX usually coincides with falling stock prices, and this stock market uncertainty often spreads to other markets. For instance, heightened volatility might boost demand for safe-haven currencies like the U.S. dollar, affecting currency pairs and trading strategies. By understanding the VIX, Forex traders can better anticipate market movements and make more informed decisions during times of economic uncertainty.
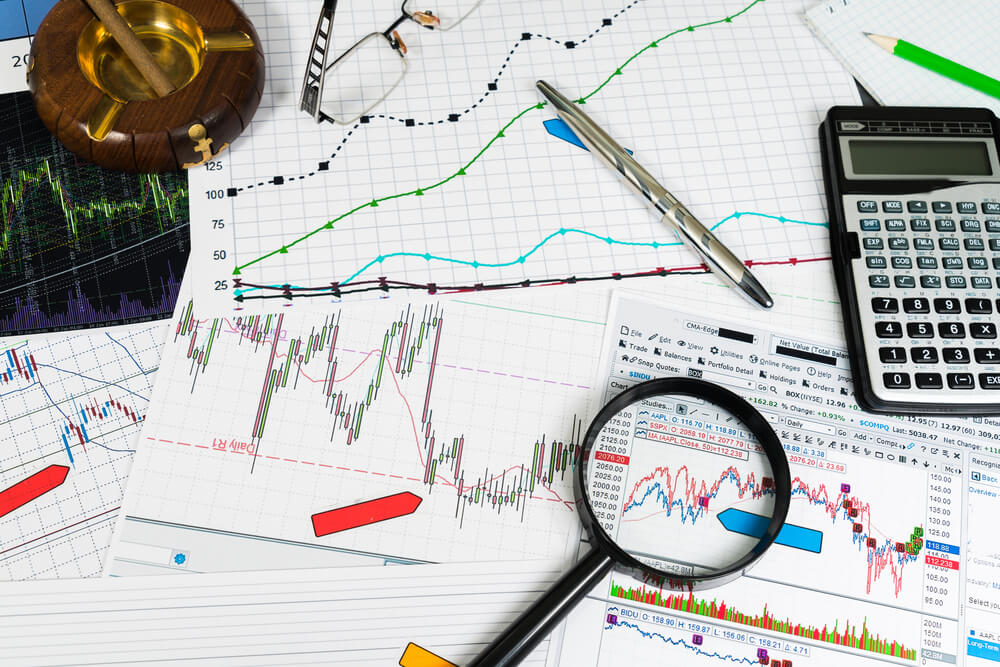
Incorporating Graphical Analysis
While graphical analysis isn’t a direct sentiment indicator, it can be a valuable tool. Chart patterns like the “hammer” or “wedge” often signal underlying market sentiment. For example, a “hammer” pattern at a support level might suggest that buyers are stepping in, countering bearish pressure.
By incorporating these patterns into your trading strategy, you can get a more complete picture of market dynamics. If sentiment indicators are showing a bullish trend, and you see a “hammer” pattern at a support level, it could strengthen your conviction to buy. On the other hand, if sentiment is bearish but you spot a “wedge” pattern suggesting a potential reversal, you might reconsider your short position.
Conclusion
Sentiment analysis in the Forex market isn’t a complete trading system on its own, but it’s a valuable tool that works well with fundamental and technical analysis. By combining sentiment analysis with other methods, you can get a more comprehensive view of the market, which can help you make better trading decisions.