In this lesson, we’ll explore the world of technical indicators. These tools can help you identify trends, predict market movements, and make smarter trading decisions. Let’s dive in and discover how technical indicators can supercharge your trading strategy.
Article content
Key Types of Technical Indicators (+ Examples)
Trend Indicators
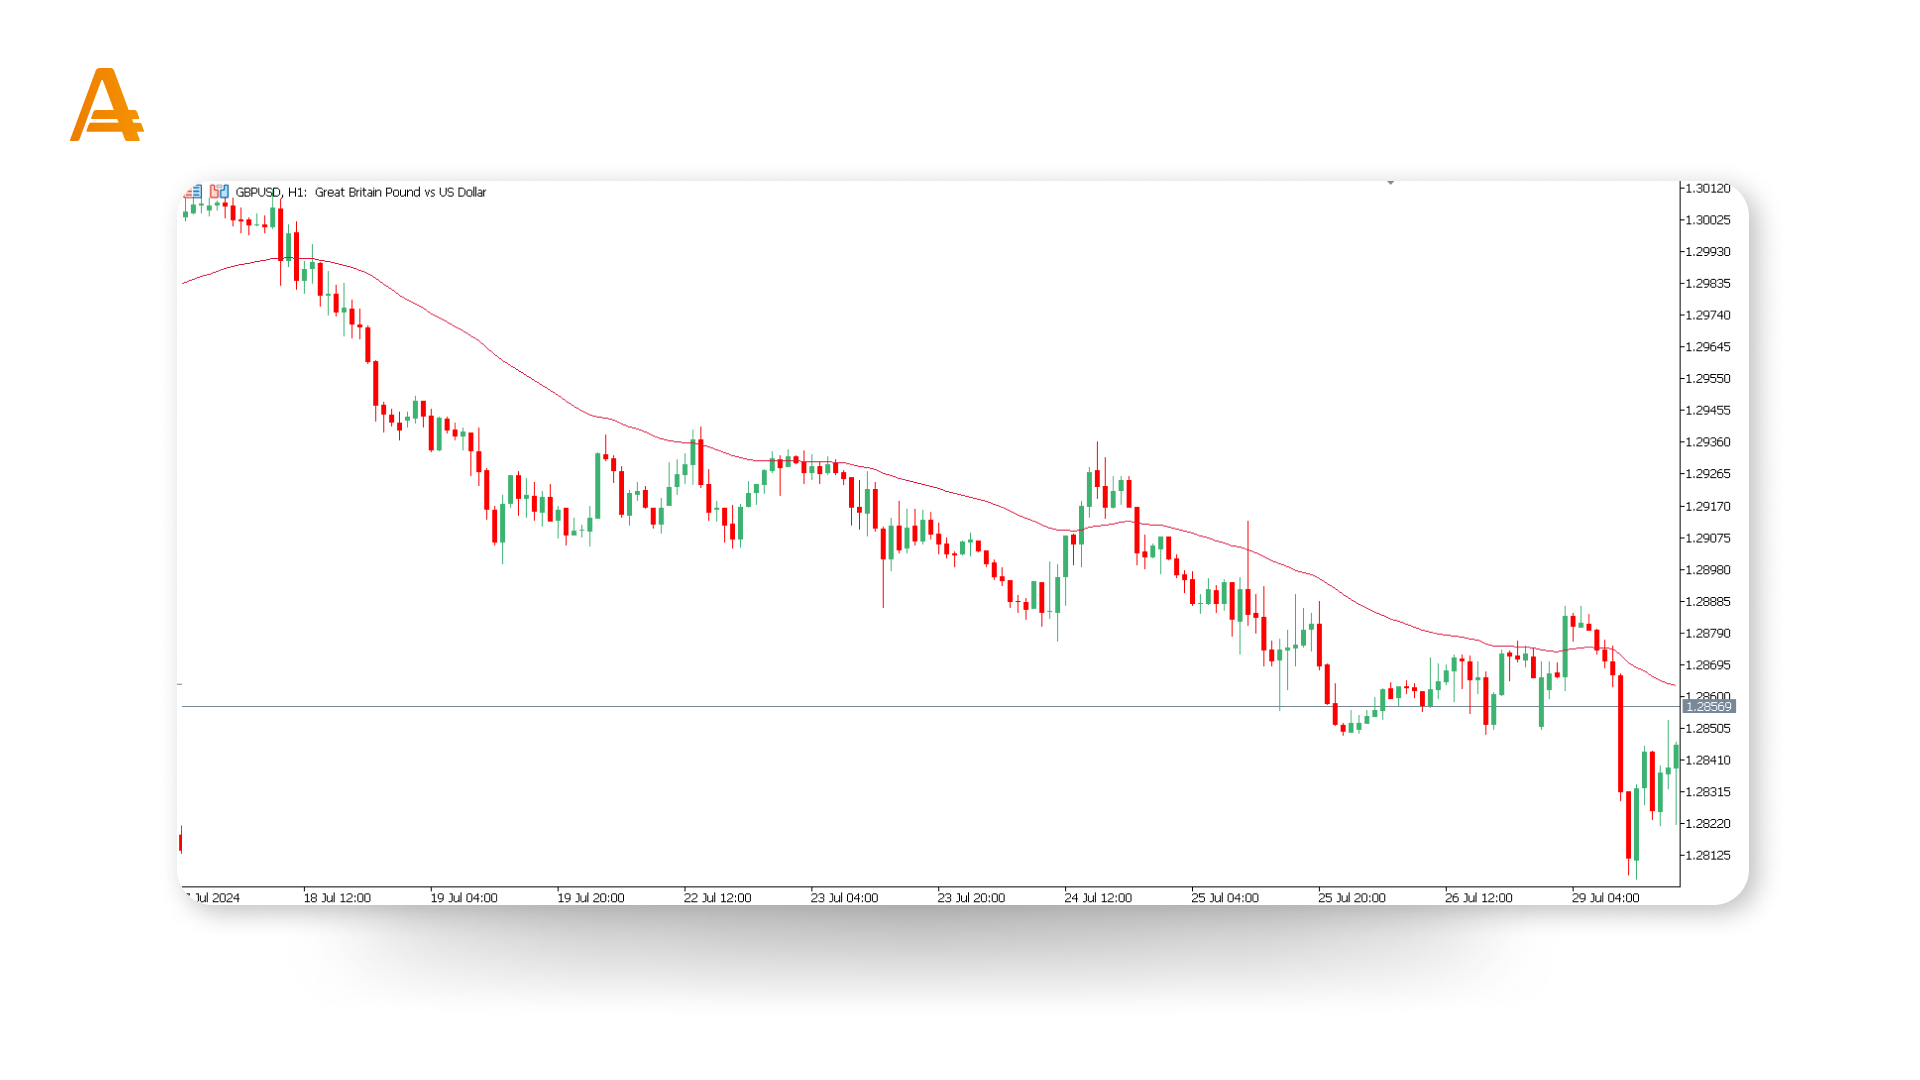
Trend indicators are essential tools that help you identify the overall direction of the market. They reveal whether prices are generally moving up, down, or sideways, giving you a clearer picture of the market’s current state.
- Moving Average (MA): This popular indicator smooths out price data over a specific period, making it easier to spot the direction of the trend.
- Average Directional Index (ADX): The ADX measures the strength of a trend, helping you determine whether a trend is strong or weak.
Momentum Indicators
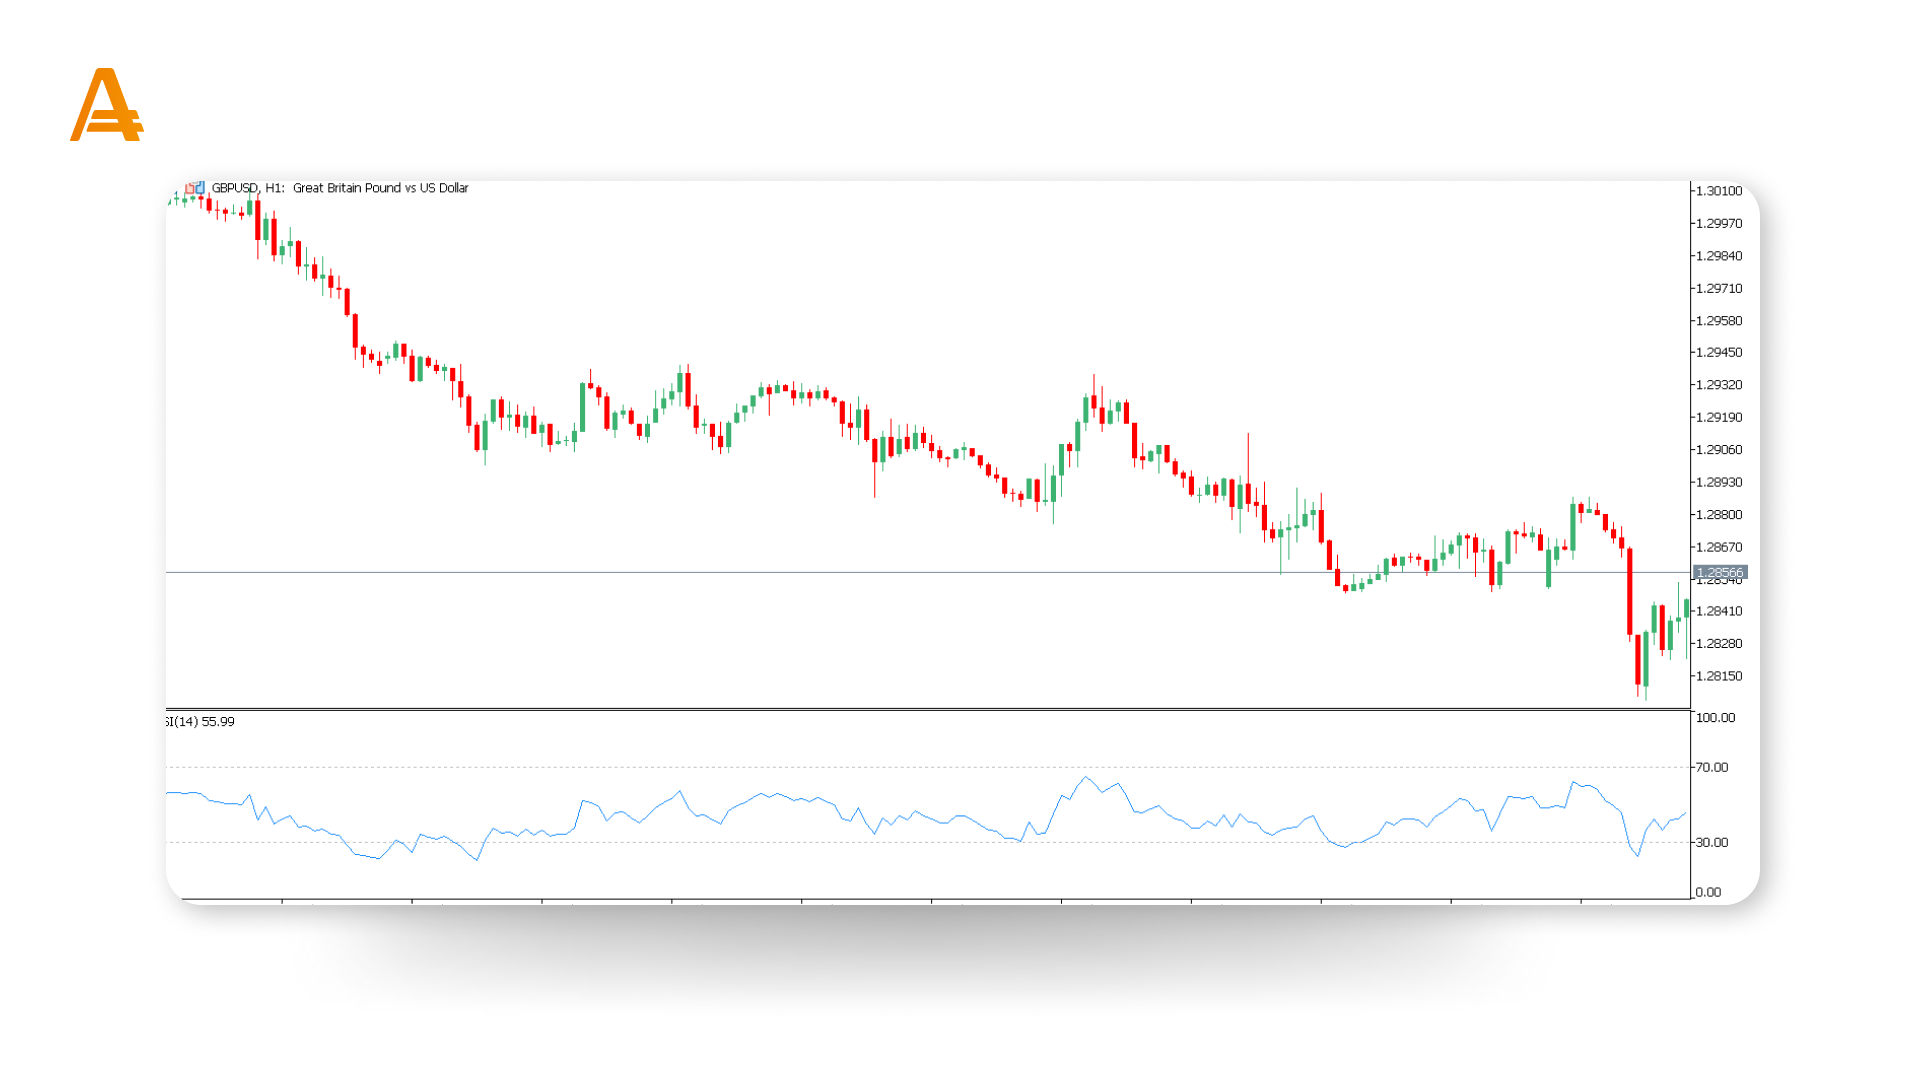
Momentum indicators measure the speed and strength of price movements. They are especially useful for identifying overbought or oversold conditions, signaling potential reversals.
- Relative Strength Index (RSI): The RSI evaluates whether an asset is overbought or oversold, offering insights into potential price reversals.
- Moving Average Convergence Divergence (MACD): The MACD tracks changes in the strength, direction, momentum, and duration of a trend, making it a versatile tool for traders.
Volume Indicators
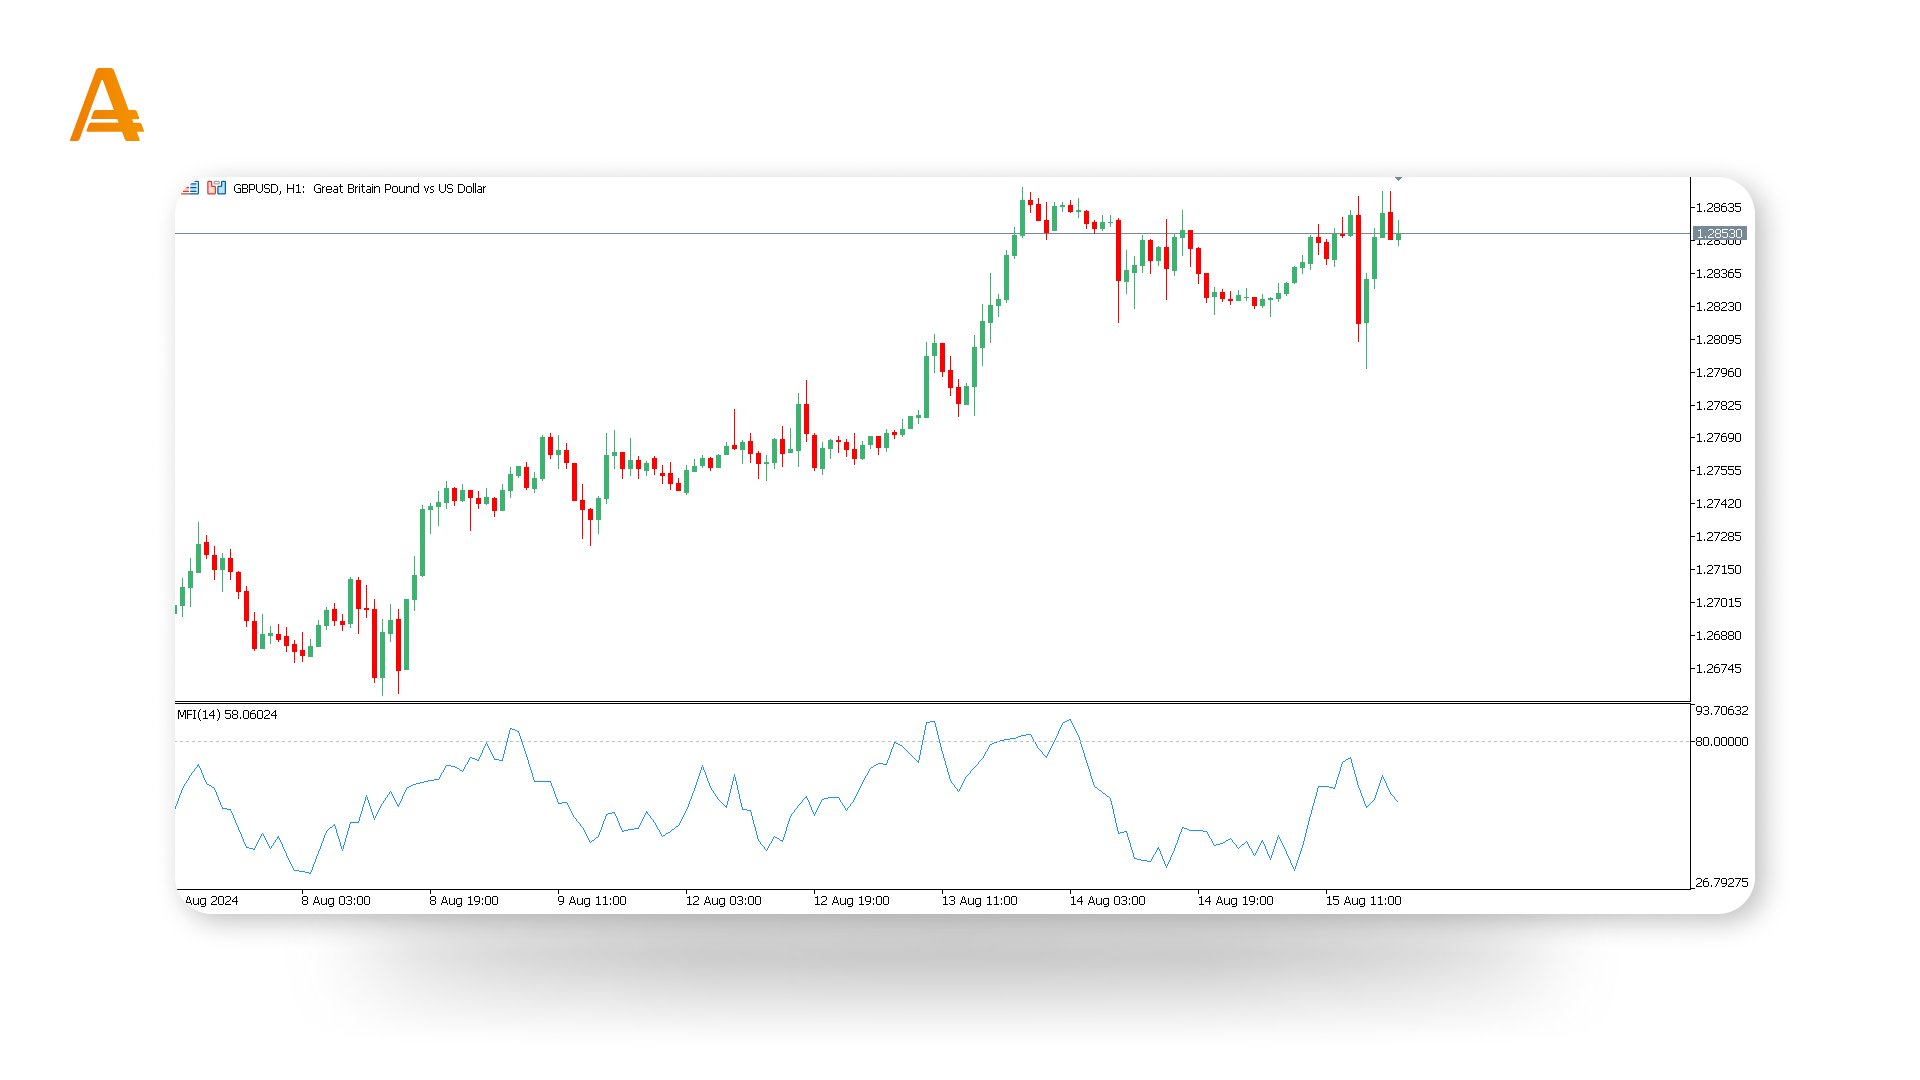
Volume indicators analyze the amount of an asset being traded over a specific period. Understanding volume is key to confirming trends and spotting potential reversals.
- On-Balance-Volume (OBV): OBV combines price and volume data to assess whether volume is driving the price in a particular direction.
- Money Flow Index (MFI): The MFI measures the flow of money into and out of an asset, helping you gauge the strength behind price movements.
Volatility Indicators
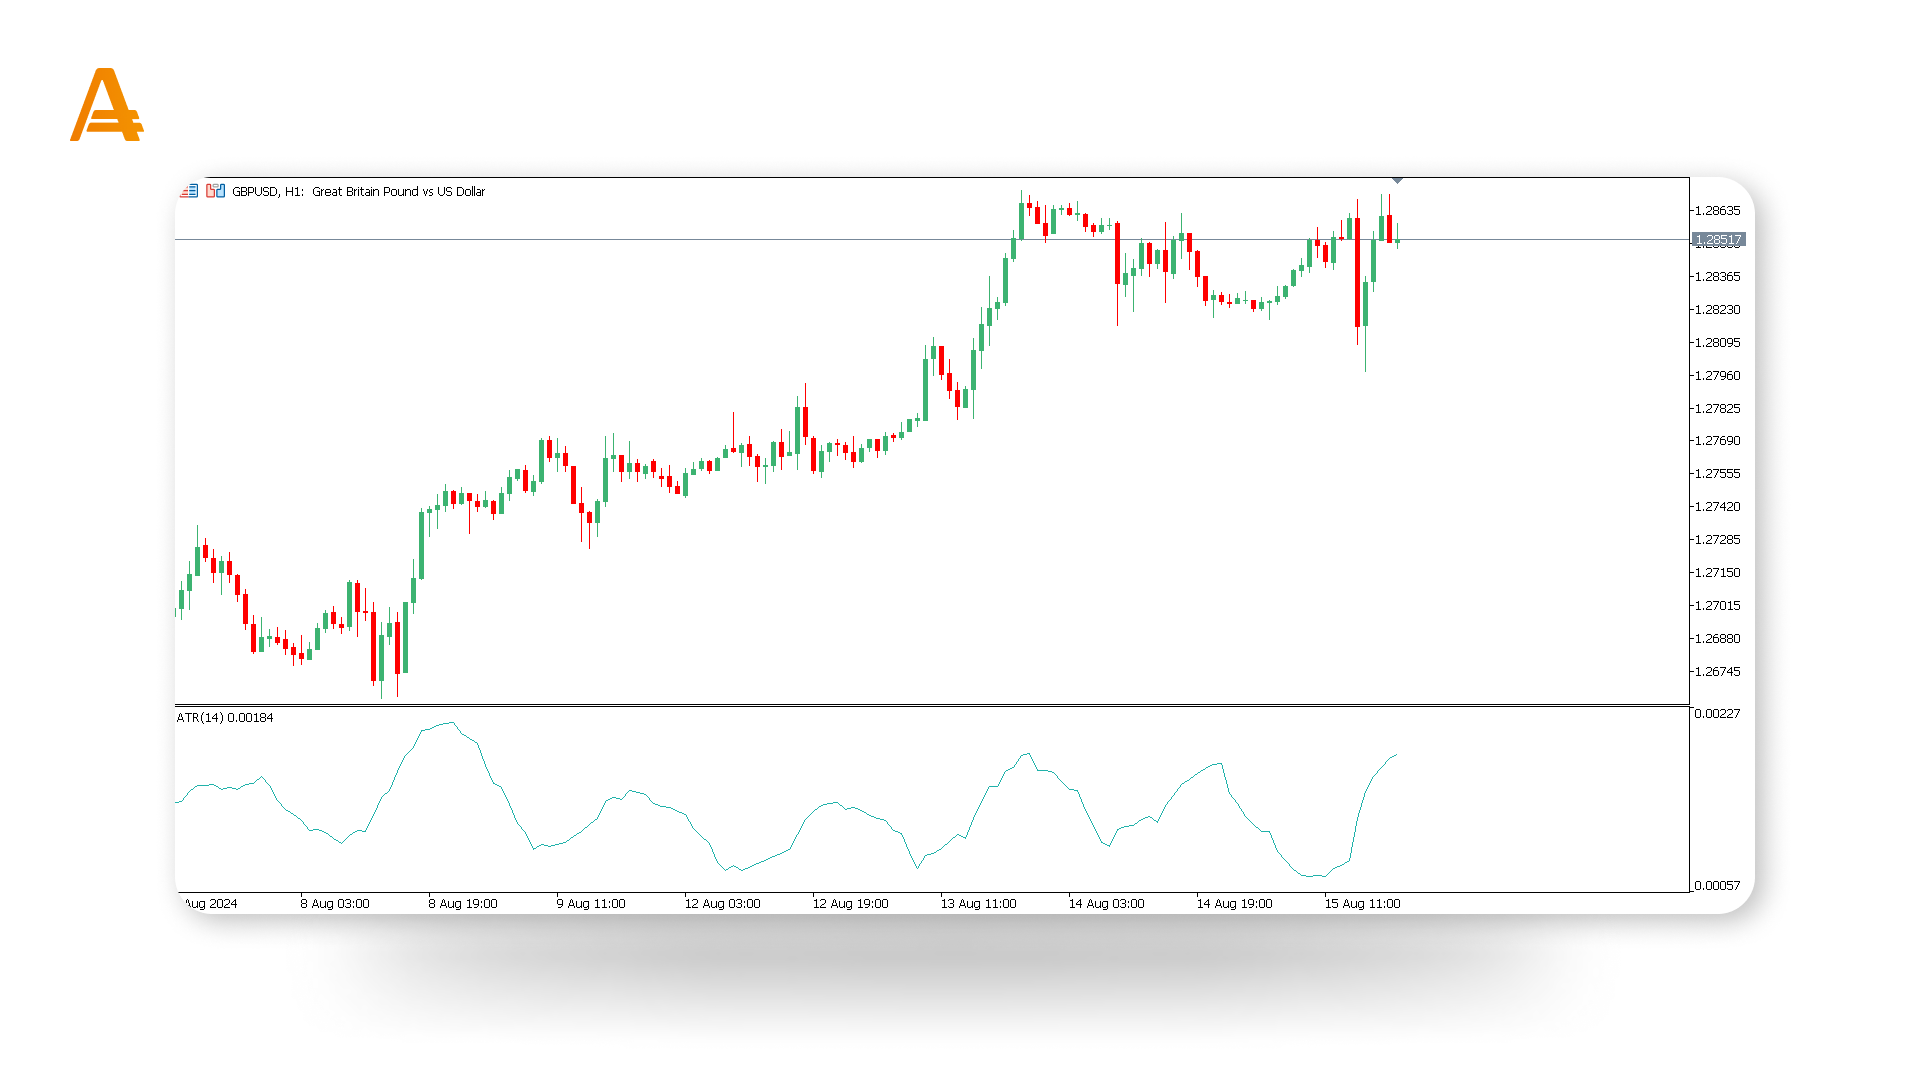
Volatility indicators measure how much an asset’s price fluctuates over time. These indicators are crucial for understanding market risk and uncertainty.
- Average True Range (ATR): The ATR, which also functions as an oscillator, shows the average range of price movements, helping you assess market volatility.
- Bollinger Bands: These bands provide a relative range of high and low prices, helping you understand price volatility within a trend.
What’s Next?
Now that you’ve got a solid grasp of the main types of technical indicators, you’re ready to dive into pattern analysis. In the next lesson, we’ll guide you through the most popular chart patterns and how to use them to enhance your trading strategy.