Welcome to Lesson 11! In this session, you’ll explore the world of chart patterns—key shapes formed by price movements that can give you valuable clues about where the market might be headed next. By the end of this lesson, you’ll know how to spot these patterns and use them to anticipate potential changes, helping you make smarter trading decisions.
Article content
Key Chart Patterns and What They Mean
Head and Shoulders / Inverted Head and Shoulders
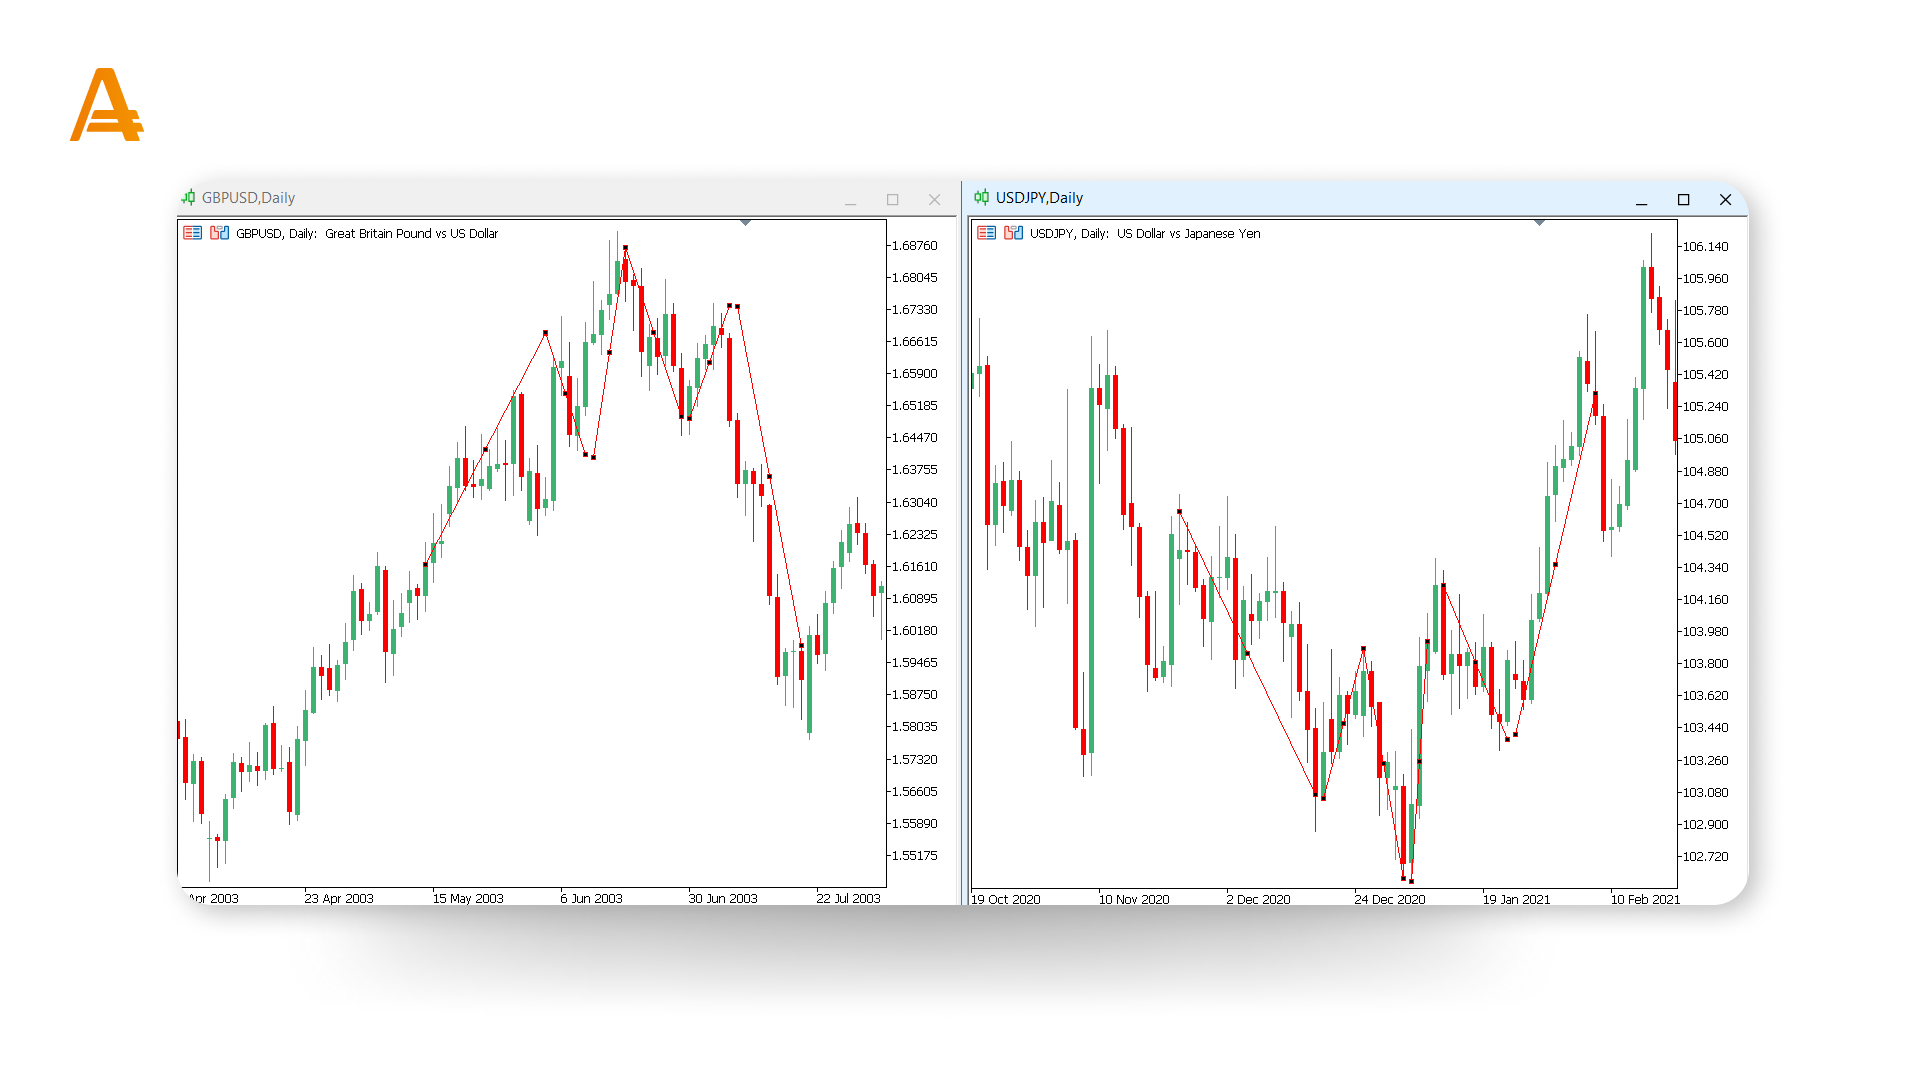
Head and Shoulders. This classic pattern signals a potential reversal from an uptrend to a downtrend. It features three peaks: a higher middle peak (the “head”) flanked by two lower peaks (the “shoulders”). When the price drops below the “neckline” after forming the right shoulder, it often indicates the start of a downtrend – typically a signal to consider selling.
Inverted Head and Shoulders. This pattern is the opposite, signaling a possible shift from a downtrend to an uptrend. Here, the lowest point forms the “head,” with two higher lows on either side as the “shoulders.” A breakout above the neckline after the right shoulder typically marks the beginning of an uptrend, making it a strong buying opportunity.
Double Top / Double Bottom
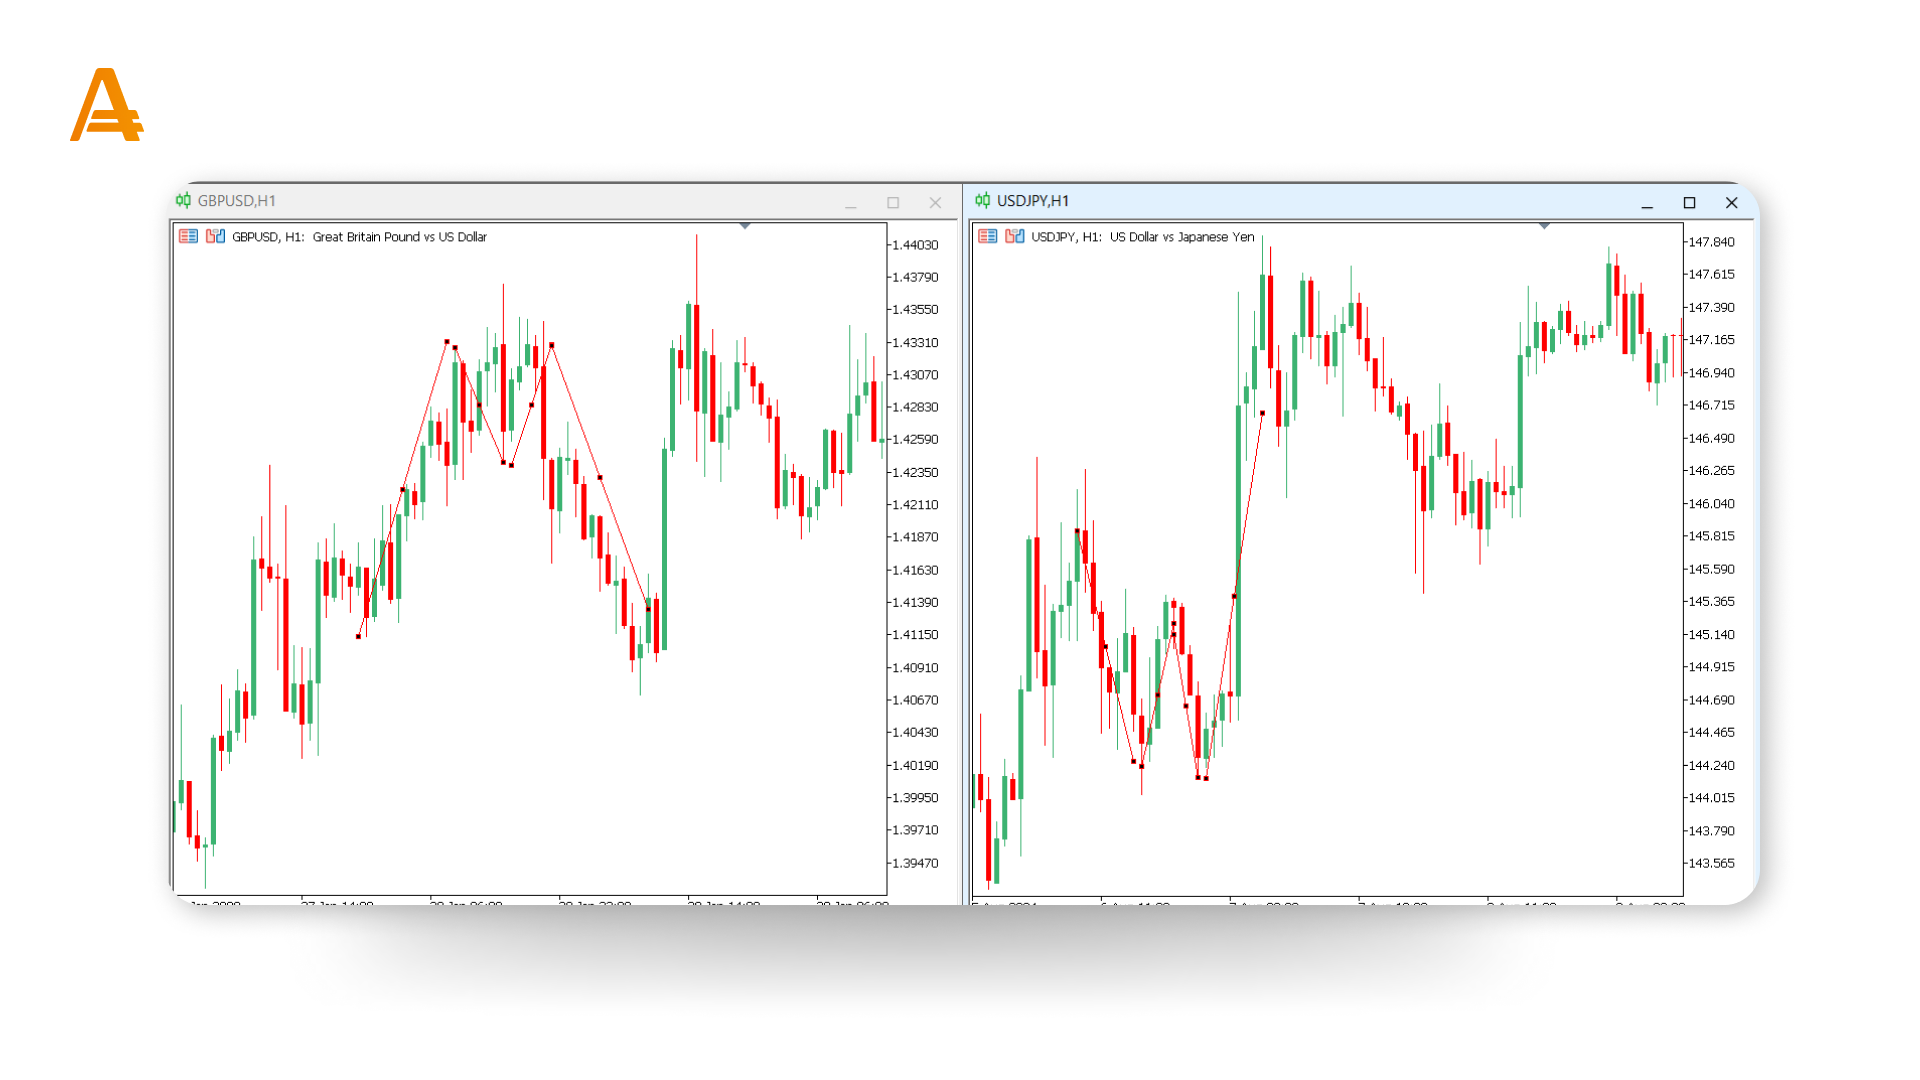
Double Top. This pattern signals a potential price drop following an uptrend. It forms when the price hits two peaks at a similar level, with a dip between them. When the price breaks below the low point between the peaks, it usually confirms a trend reversal, indicating it might be time to sell.
Double Bottom. This pattern suggests a possible price rise after a downtrend. It’s identified by two lows at a similar level, separated by a peak. When the price breaks above the peak between the lows, it confirms a trend reversal, signaling a good time to buy.
Bullish / Bearish Flags
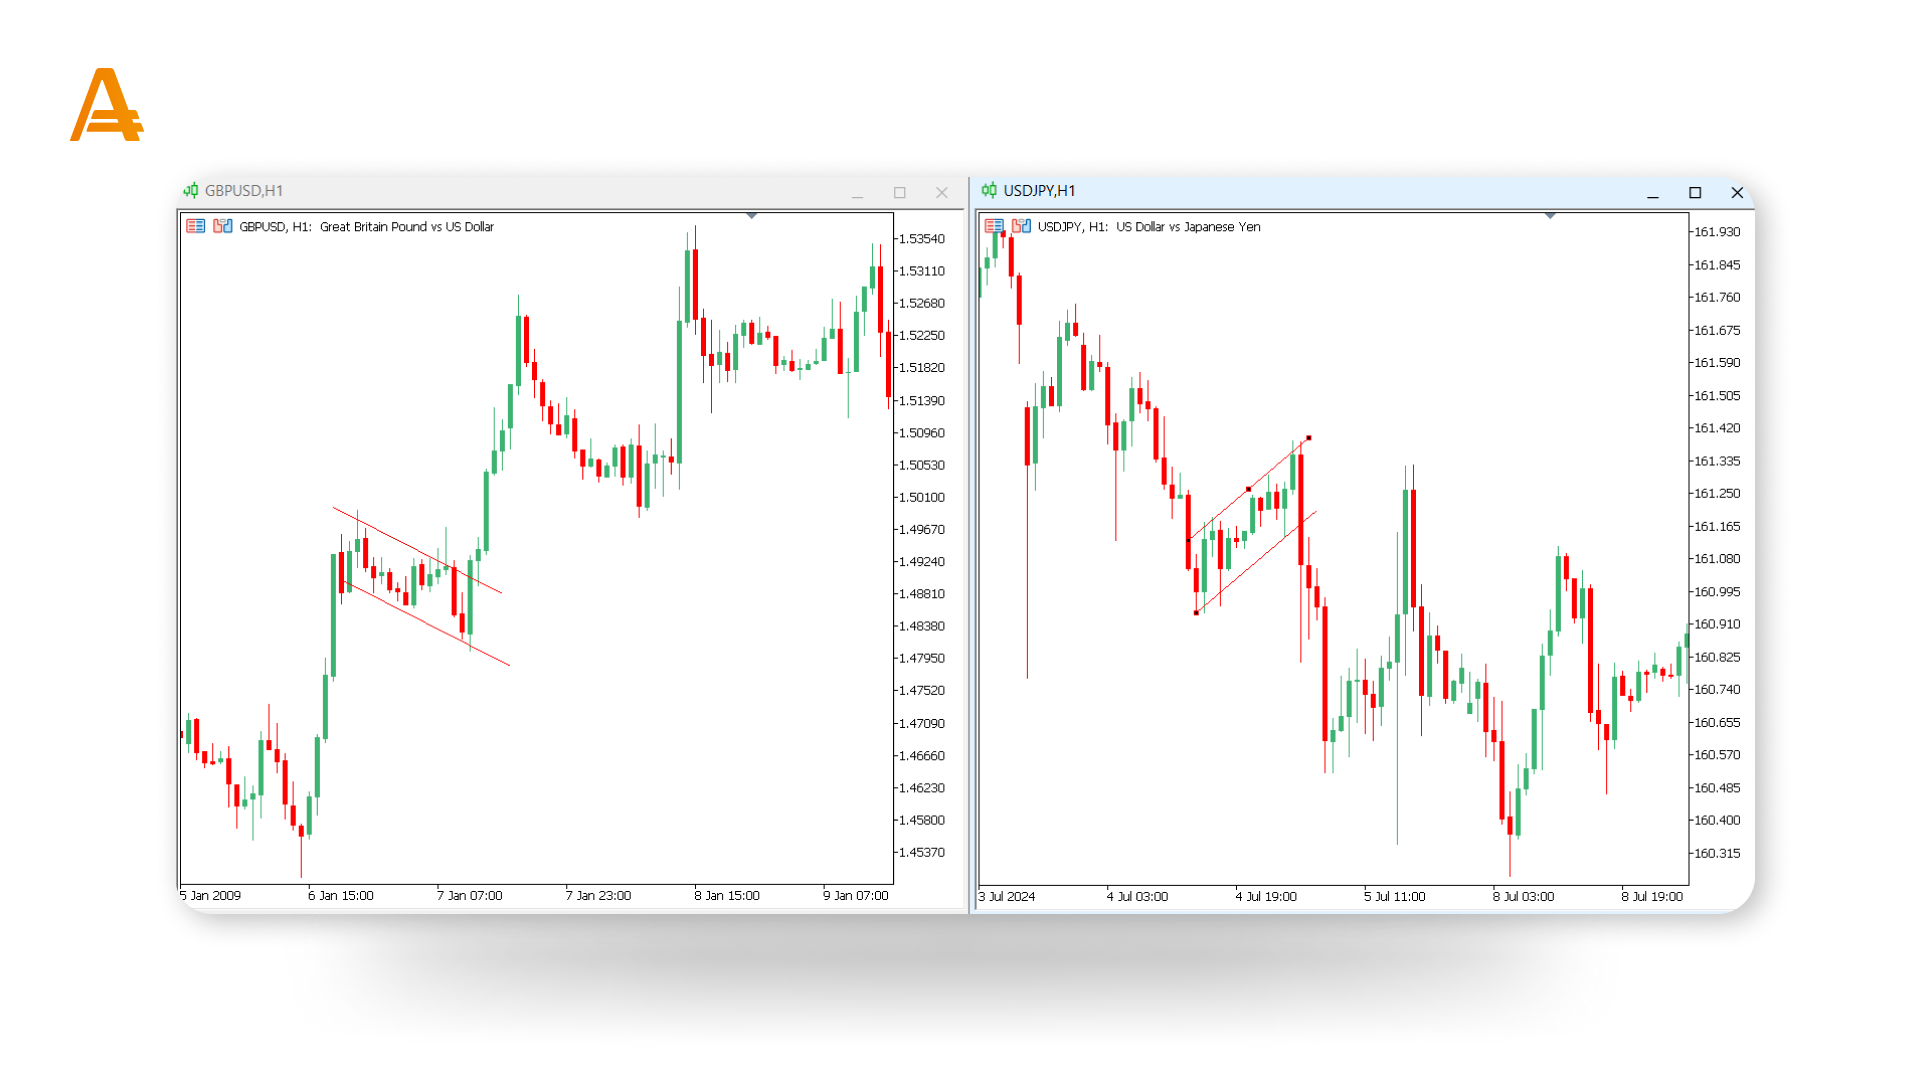
Bullish Flags. These patterns appear during an uptrend, showing a brief pause before the price likely continues to rise. They resemble small downward-sloping rectangles. When the price breaks above the flag, it usually signals the uptrend will resume – an ideal time to consider buying.
Bearish Flags. These are the inverse, appearing as small upward-sloping rectangles during a downtrend. A break below the flag generally suggests the downtrend will continue, indicating a selling opportunity.
These are some of the most popular chart patterns used by successful traders to predict market movements. By mastering these patterns, you’ll be better equipped to make informed trading decisions. In the next lesson, we’ll dive into some of the most effective technical analysis strategies, helping you build a solid trading foundation.


