
In this lesson, we’ll dive into the basics of technical analysis, a popular method traders use to predict market movements by studying past price trends.
Article content
What is Technical Analysis?
Technical analysis involves using charts and historical data, like price movements and trading volume, to make predictions about the market. Unlike fundamental analysis, which looks at company reports, macroeconomic data, and news, technical analysis focuses on identifying patterns and trends to anticipate where prices might go.
Why Use Technical Analysis?
The goal of technical analysis is to determine where prices are headed and identify the best times to enter or exit a trade. By understanding where the market is currently, you can make more informed forecasts about its future direction.
Key Principles
- History Repeats Itself: Market trends and patterns from the past often resurface in the future.
- Prices Reflect Everything: Current prices incorporate all available market information.
- Trends Have Momentum: Once a trend is established, it’s more likely to continue than to reverse.
Types of Charts
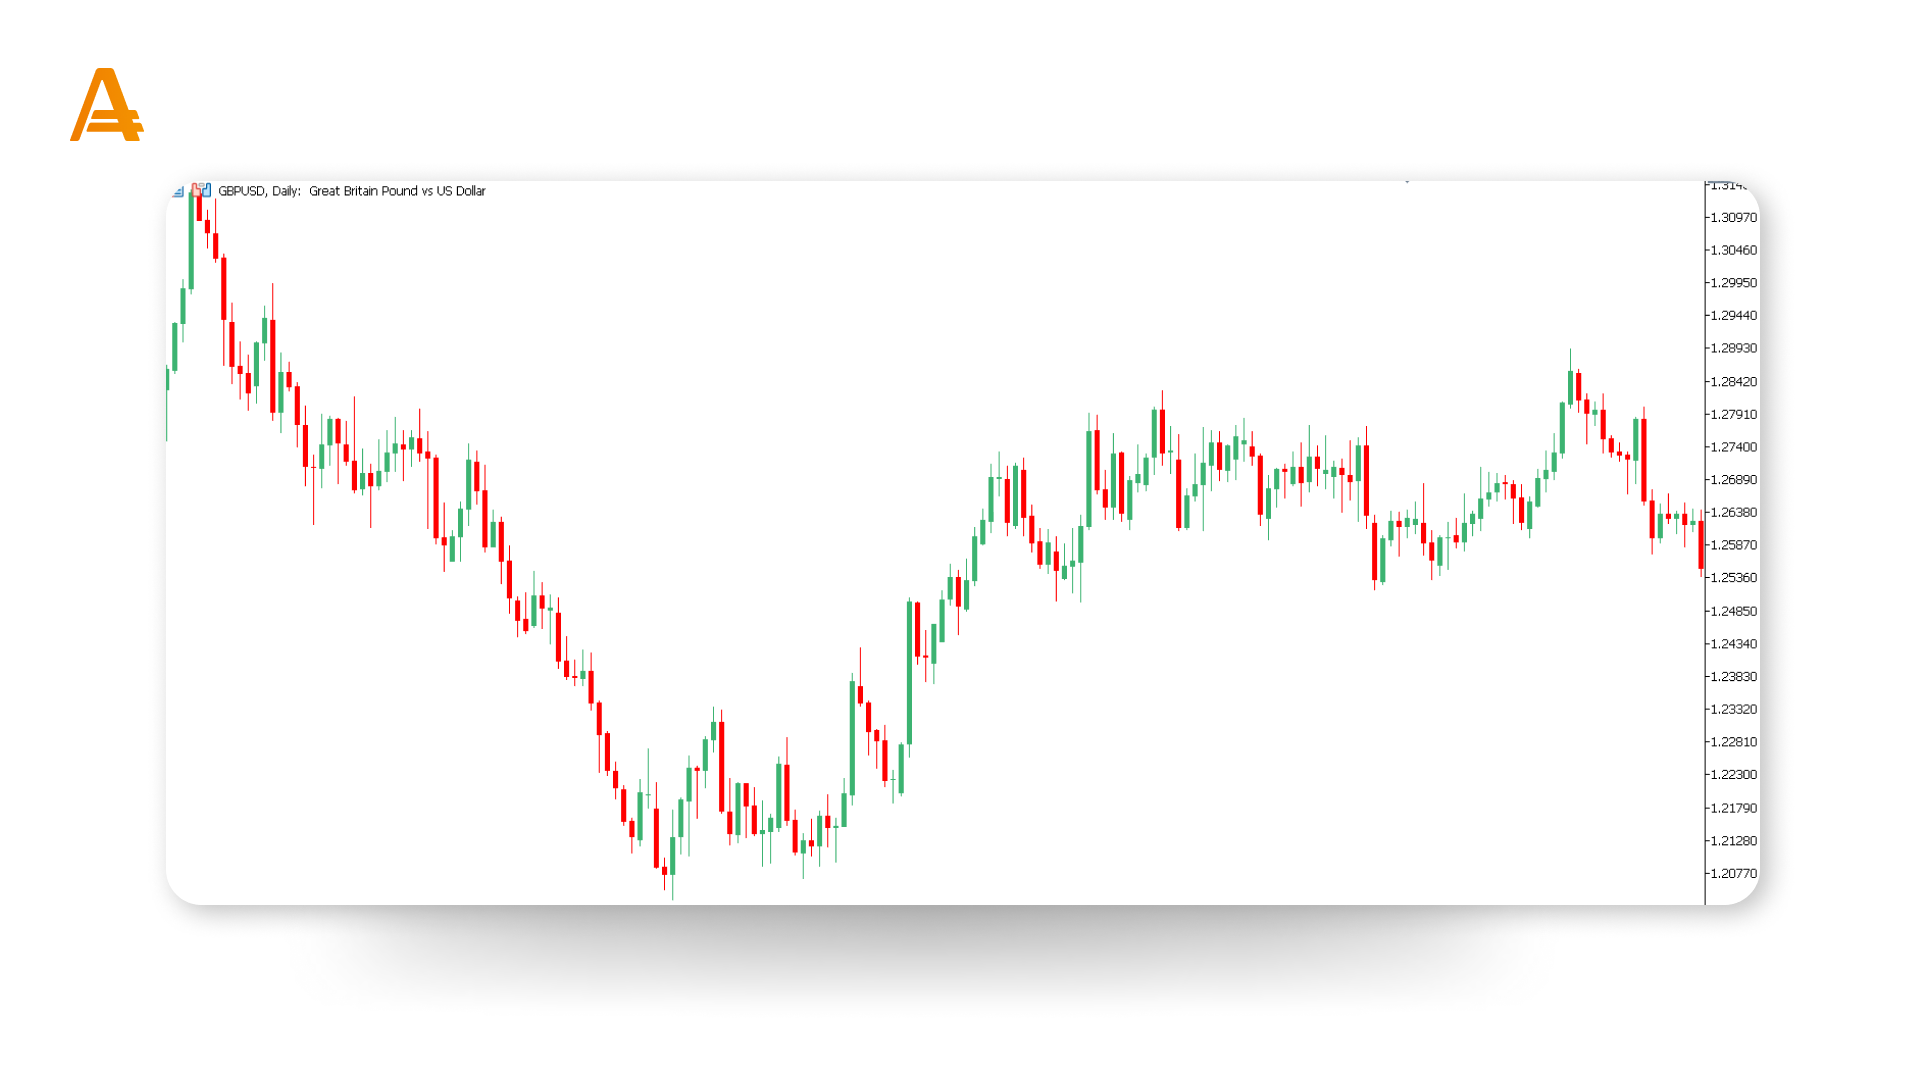
Candlestick Charts
Candlestick charts are among the most popular tools in technical analysis. They display the open, close, high, and low prices for a specific period, such as a day, an hour, or even five minutes.
- Green (or White) Candle: Indicates that the price increased during the period.
- Red (or Black) Candle: Indicates that the price decreased during the period.
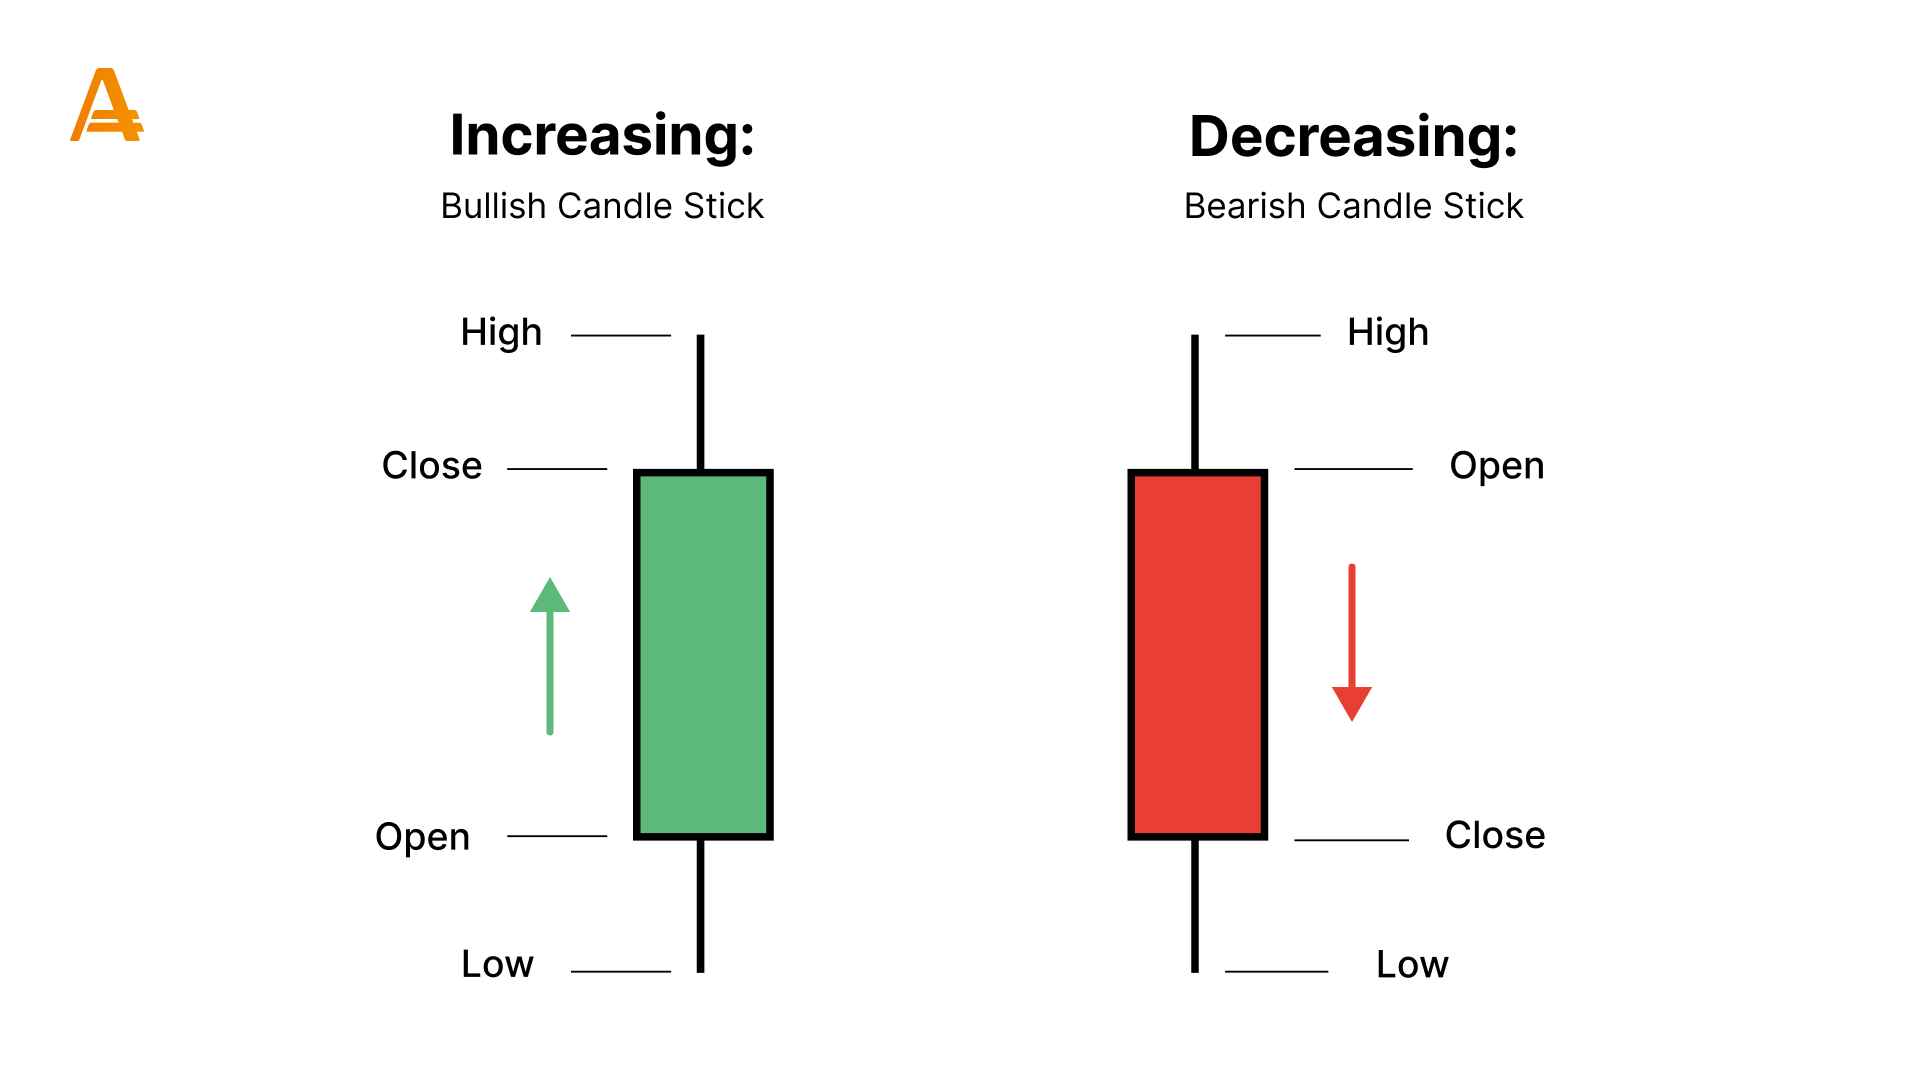
Candlestick charts are powerful tools for traders because they reveal trends, potential reversals, and key support and resistance levels, making them invaluable for predicting future price movements.
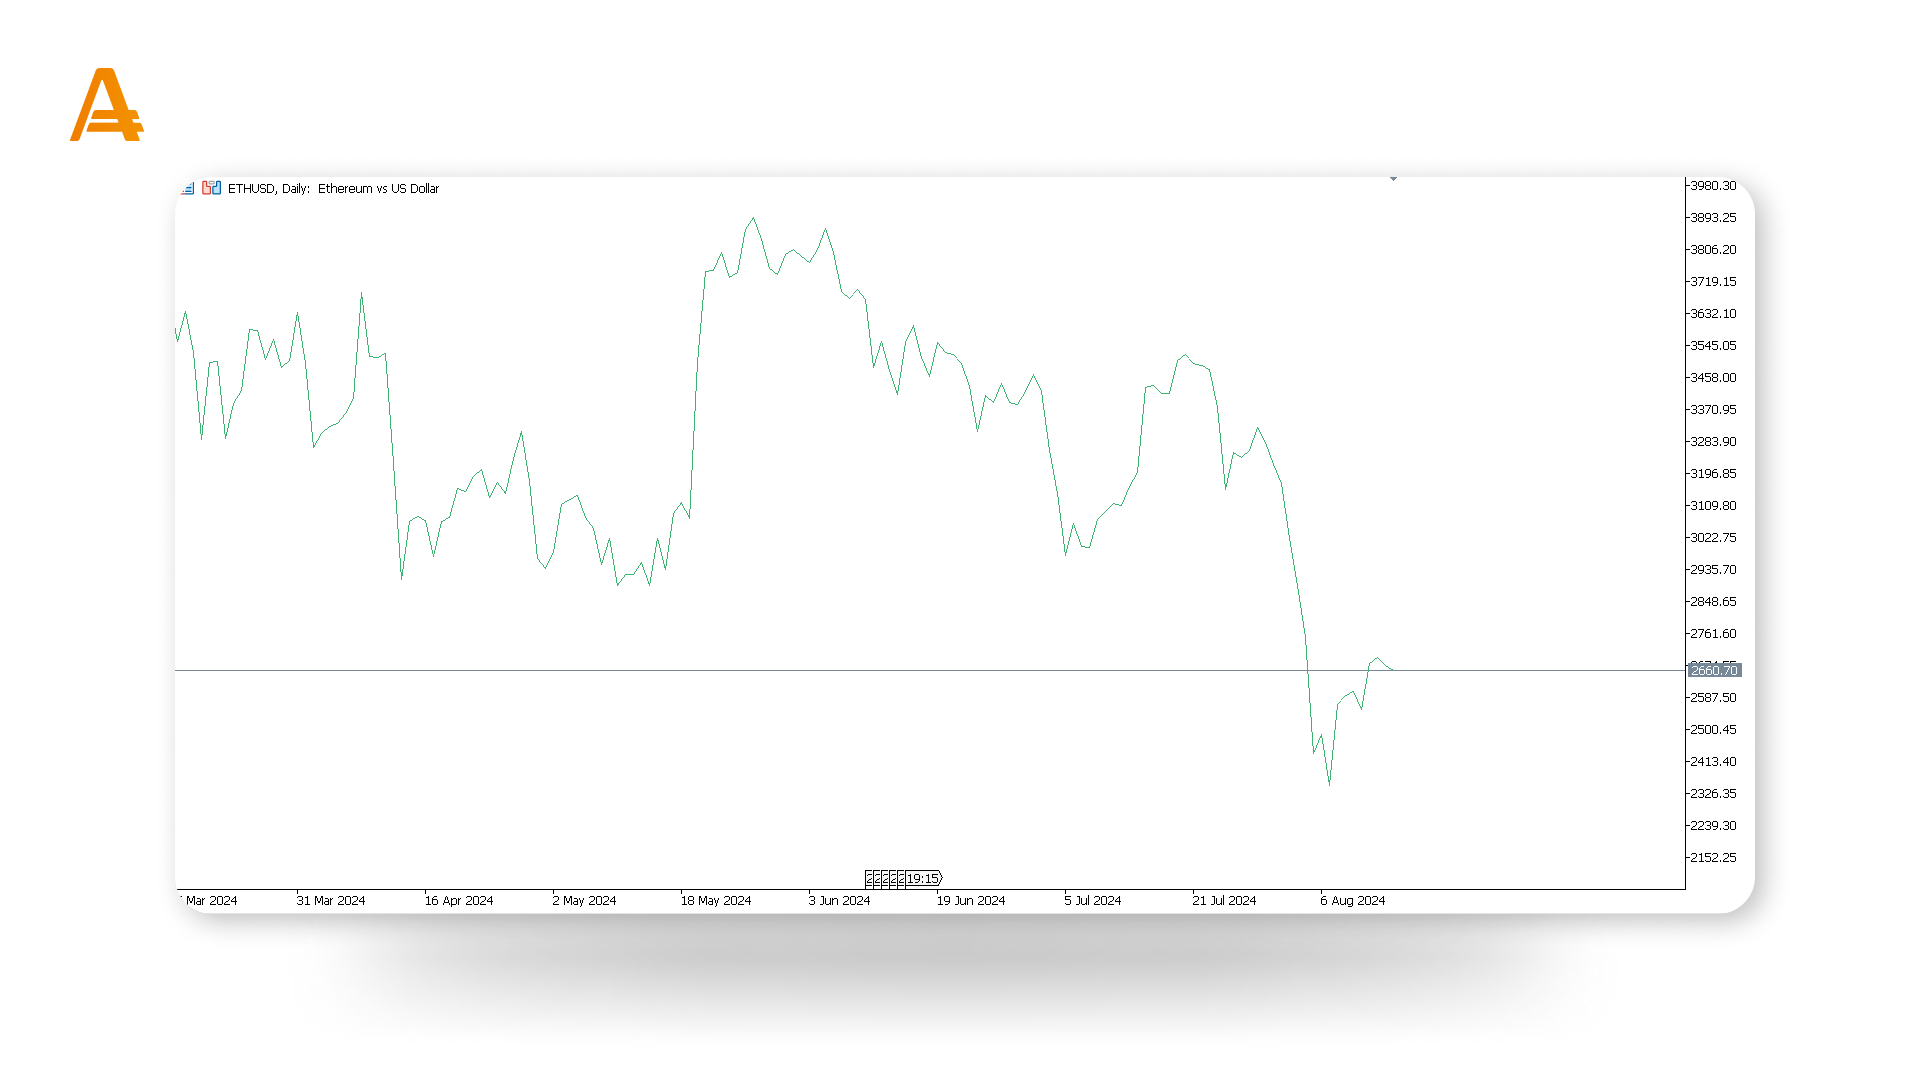
Line Charts
Line charts connect price points over time, providing a clear view of overall trends. While they offer a straightforward visual of price movement, they don’t provide as much detail as candlestick charts.
Bar Charts
Bar charts show the opening and closing prices as well as the highest and lowest prices during a given period. They offer a detailed snapshot of price movement, combining elements of both line and candlestick charts.
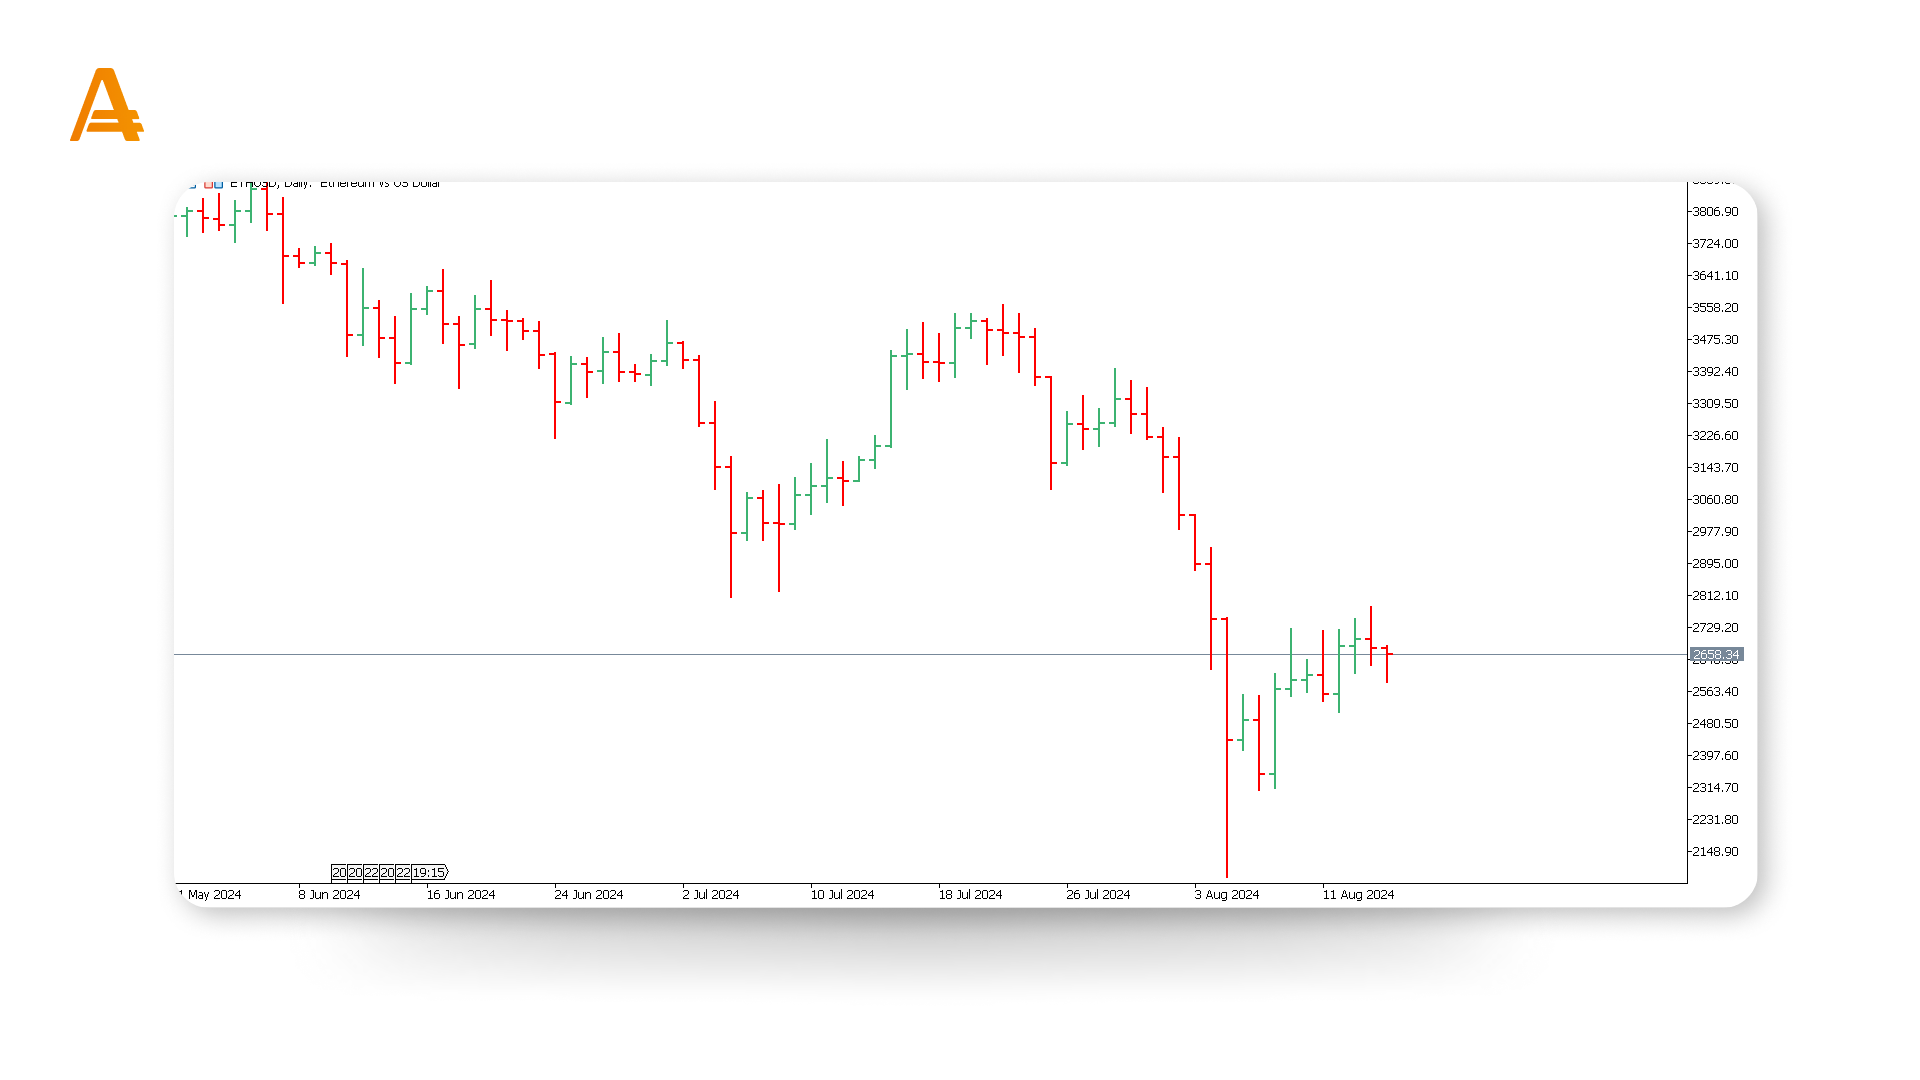
Each chart type has its own strengths. Line charts give you a broad view of price trends, while candlestick and bar charts provide more detailed information about price movements.
In the next lesson, we’ll explore how to identify and analyze market trends. Stay tuned!