
In this lesson, we’ll delve into one of the most essential concepts in technical analysis: market trends. Understanding trends is a cornerstone of successful trading. Let’s explore how to identify and capitalize on them.
Article content
What Are Trends?
A trend represents the general direction in which the price of an asset is moving. By identifying the trend, you can align your trades with the market’s direction, increasing your chances of success. There are three primary types of trends:
Uptrend
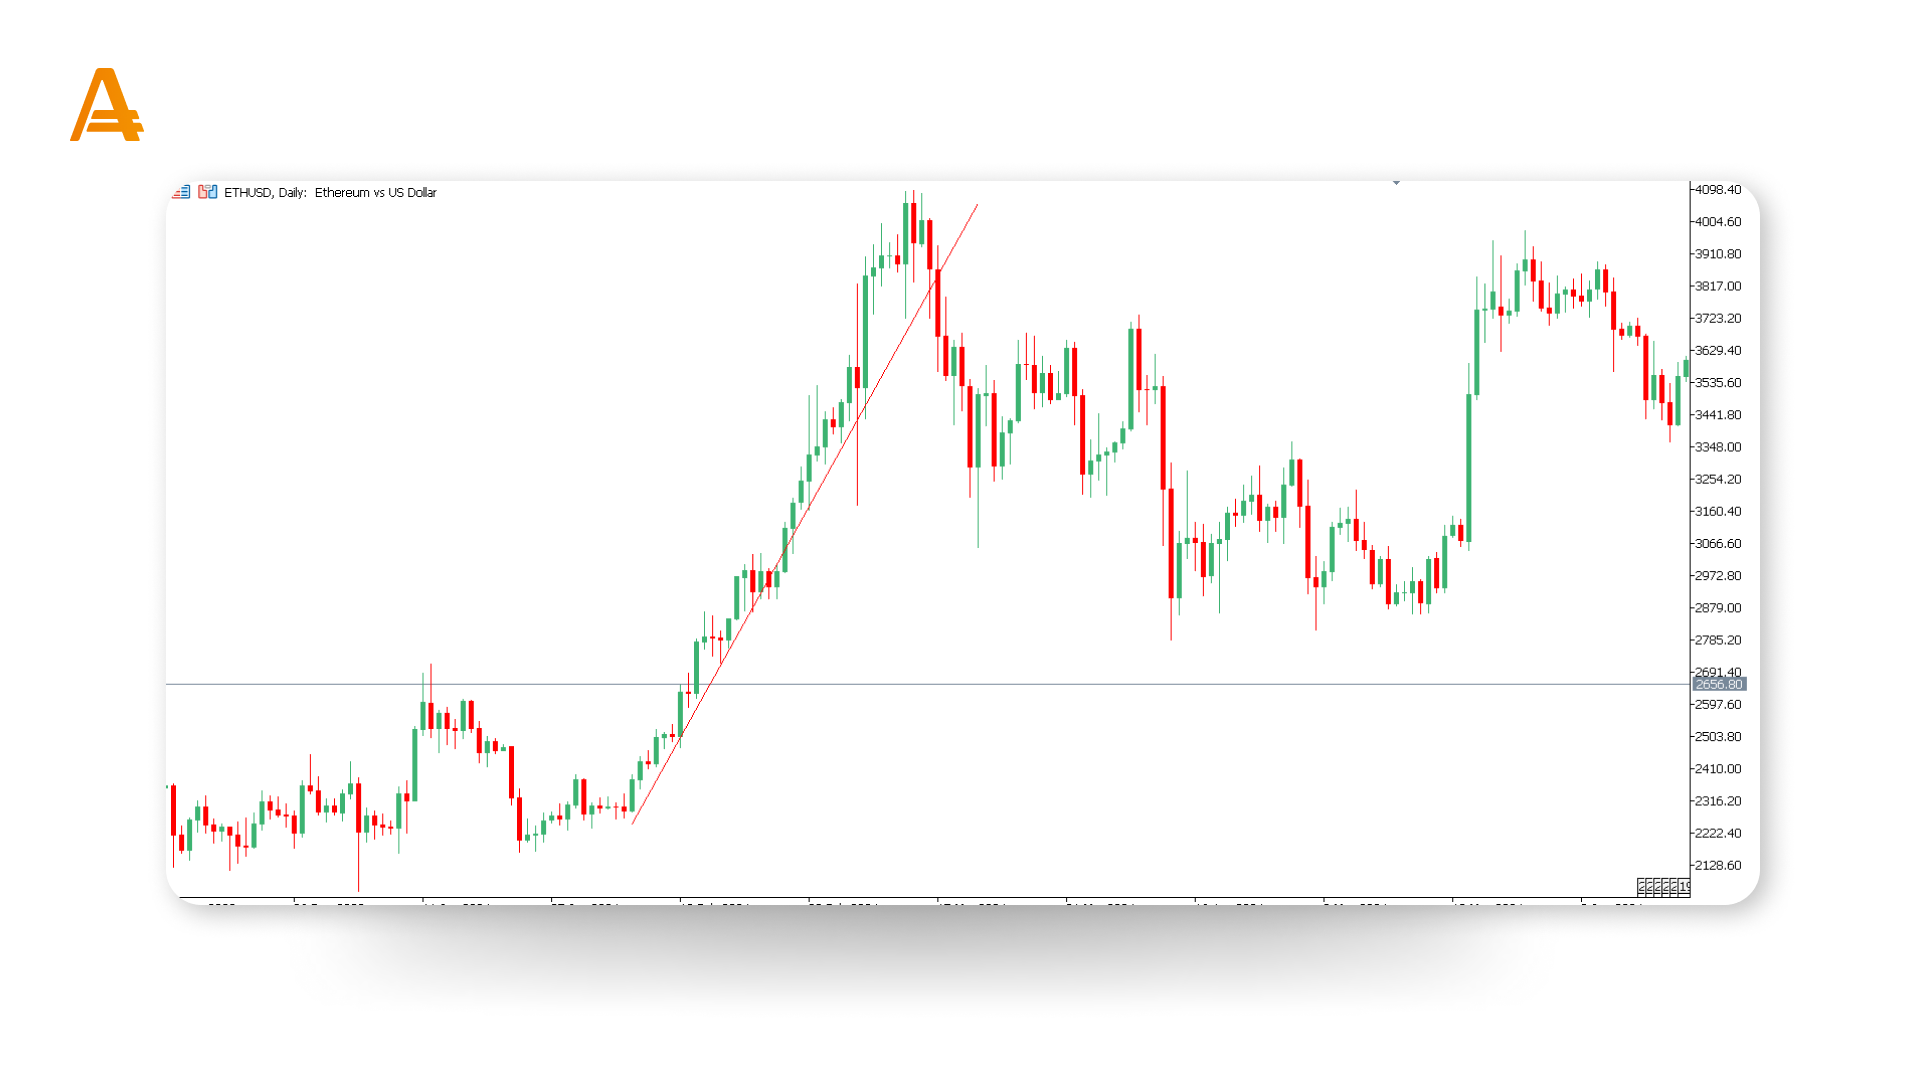
In an uptrend, prices consistently move higher, forming a series of higher highs and higher lows. This indicates that the market is growing and buyers are in control.
Downtrend
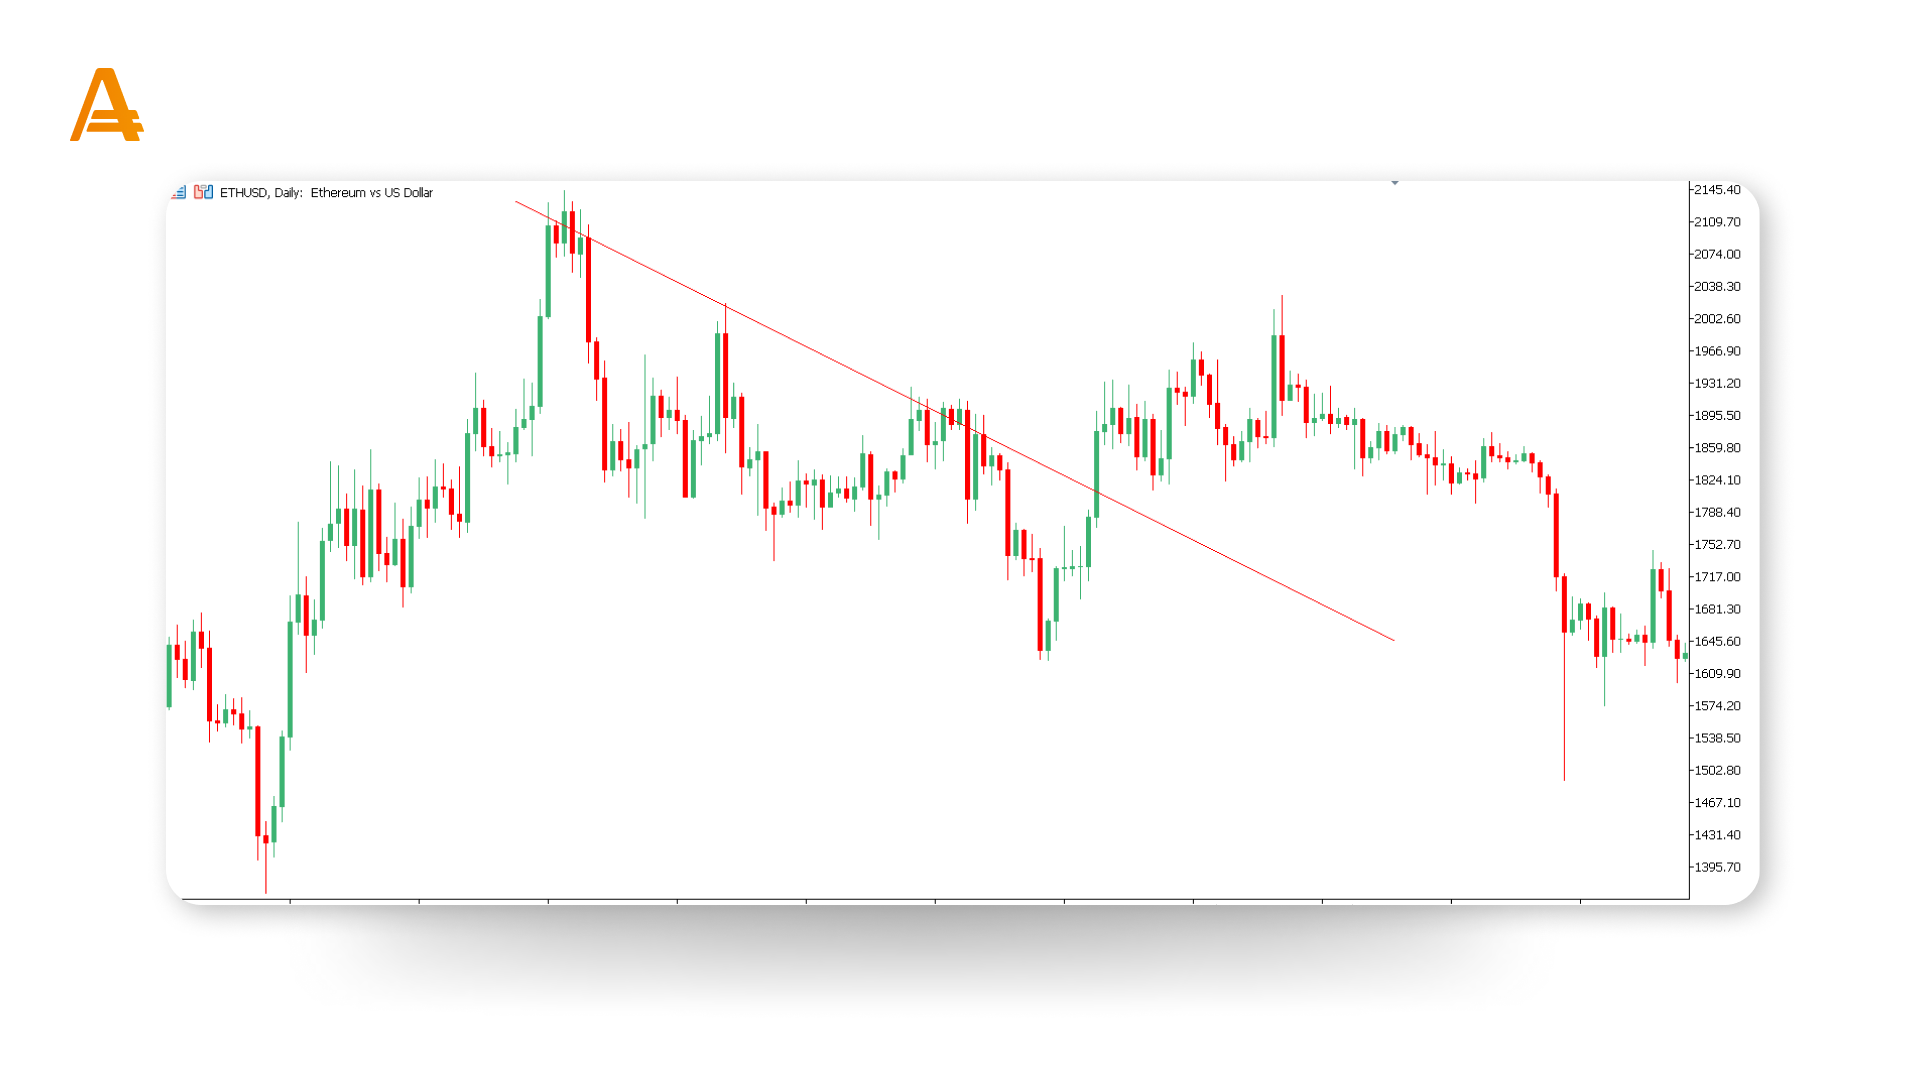
A downtrend occurs when prices consistently move lower, forming lower highs and lower lows. This signals that the market is declining, and sellers are in control.
Sideways Trend (Range-bound)
In a sideways trend, prices move within a specific range without a clear upward or downward direction. This occurs when supply and demand are relatively balanced. Sideways trends often indicate consolidation before the market breaks out in a new direction. Traders may trade within the range or wait for a breakout.
How to Identify Trends: Trendlines, Support, and Resistance
Identifying trends is a vital skill for any trader. Here are some tools to help you recognize and use trends effectively:
Trendlines
Trendlines connect a series of highs or lows to visualize the direction of the market. An upward trendline connects the lows in an uptrend, while a downward trendline connects the highs in a downtrend.
By drawing trendlines, you can better understand the strength and duration of a trend. Trendlines can also act as support or resistance levels, indicating where the price might reverse.
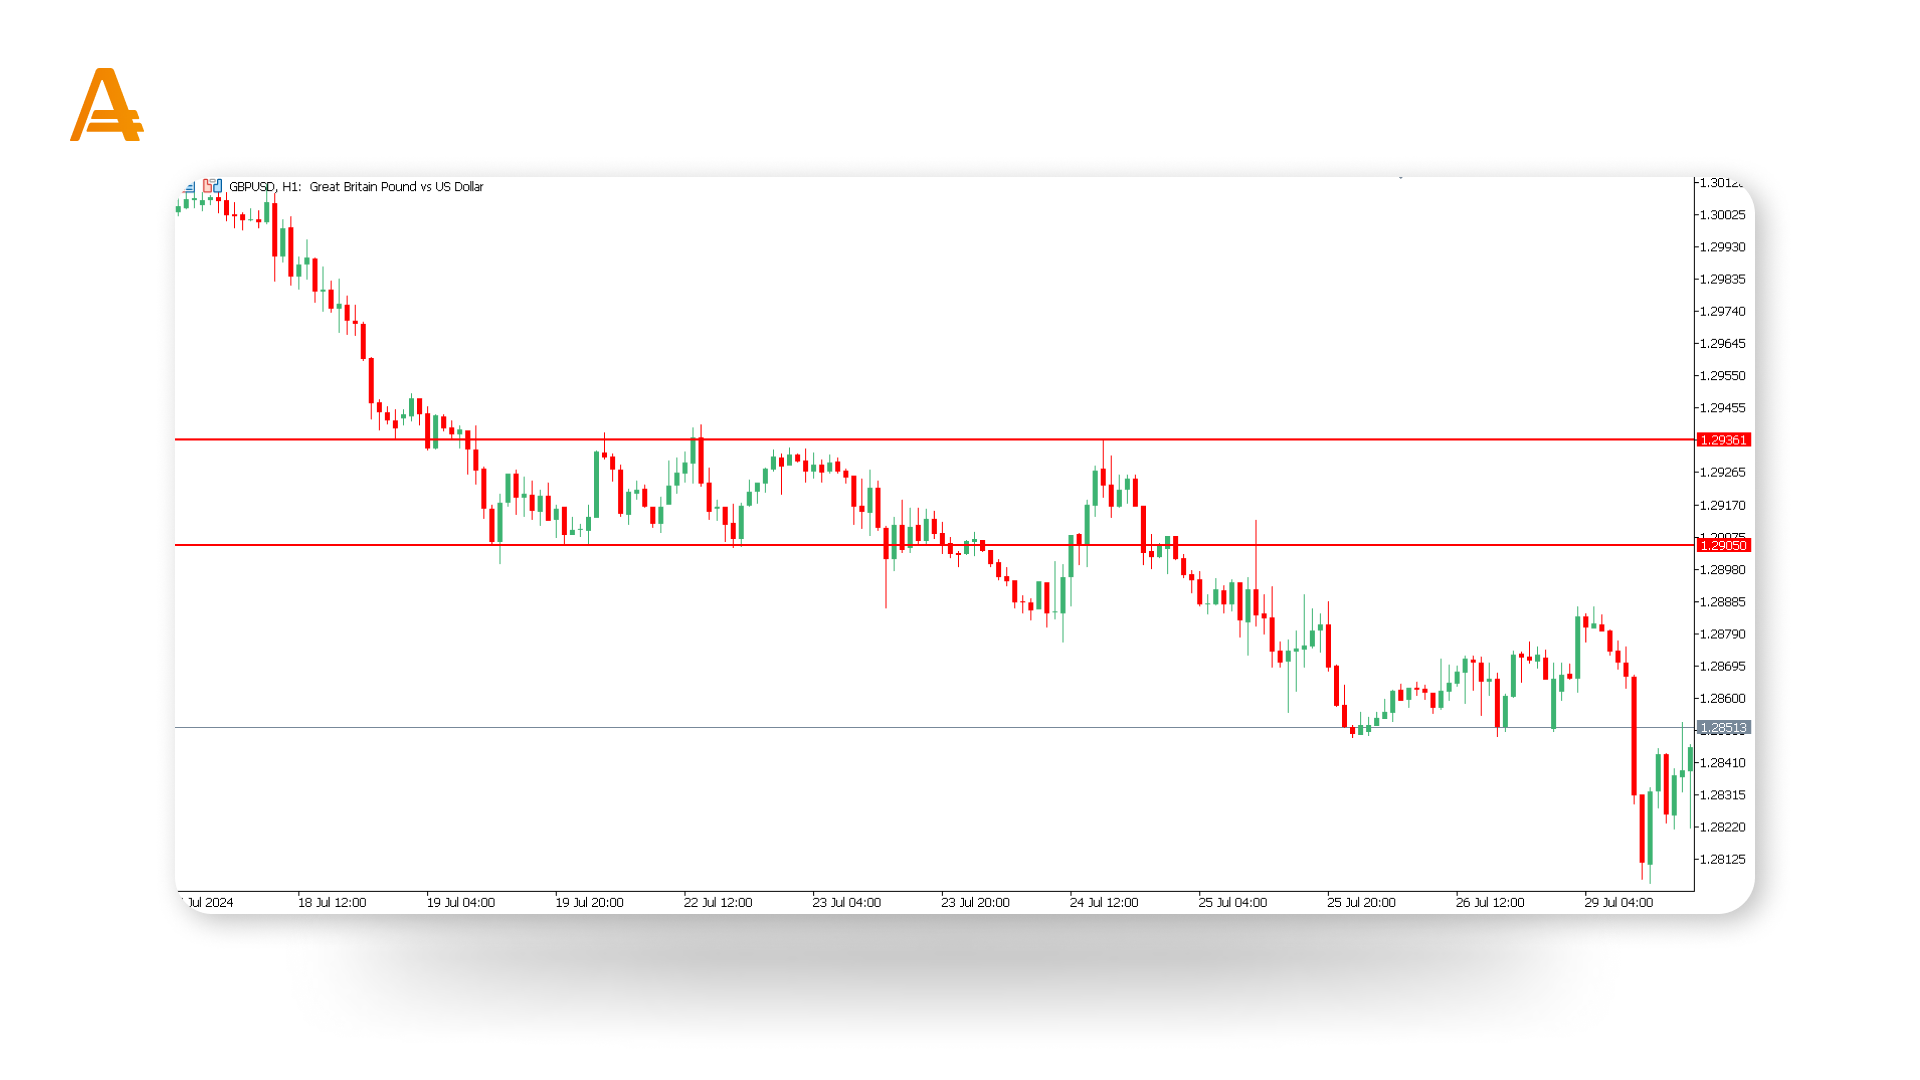
Support and Resistance Levels
Support is a price level where a downtrend could pause due to a concentration of demand. Resistance is a price level where an uptrend might stall due to a concentration of supply.
These levels are crucial for traders, as they often indicate potential entry or exit points. For example, buying at support or selling at resistance can be a strategic approach.
Putting It All Together
Understanding and identifying trends, along with using trendlines and support/resistance levels, will give you a strong foundation in technical analysis. These tools help you make well-informed trading decisions, whether you’re looking for the perfect entry point, setting a stop-loss, or planning your exit.
What’s Next?
Now that you’ve mastered the basics of trends, get ready for our next lesson. We’ll introduce you to technical indicators, which are powerful tools that can help you find trading signals and refine your strategy.
Lesson 10. Supercharge Your Trading with Technical Indicators