The key goal of a trader is to identify the best moments to open and close trades. While there’s no tool that works perfectly every time, some can significantly boost your chances of success. One such tool is divergence in the Forex market.
In this article, we’ll break down what divergence is, how it works, and how you can start using it effectively in your trading strategy.
Article content
What is Classic Divergence?
Simply put, “divergence” means “discrepancy.” If you’ve used oscillators before, you’ve likely noticed that, during trends or in sideways markets, the indicator chart usually moves in line with the price chart. Take a look at this example with the EUR/USD pair on a four-hour timeframe using the Stochastic indicator.
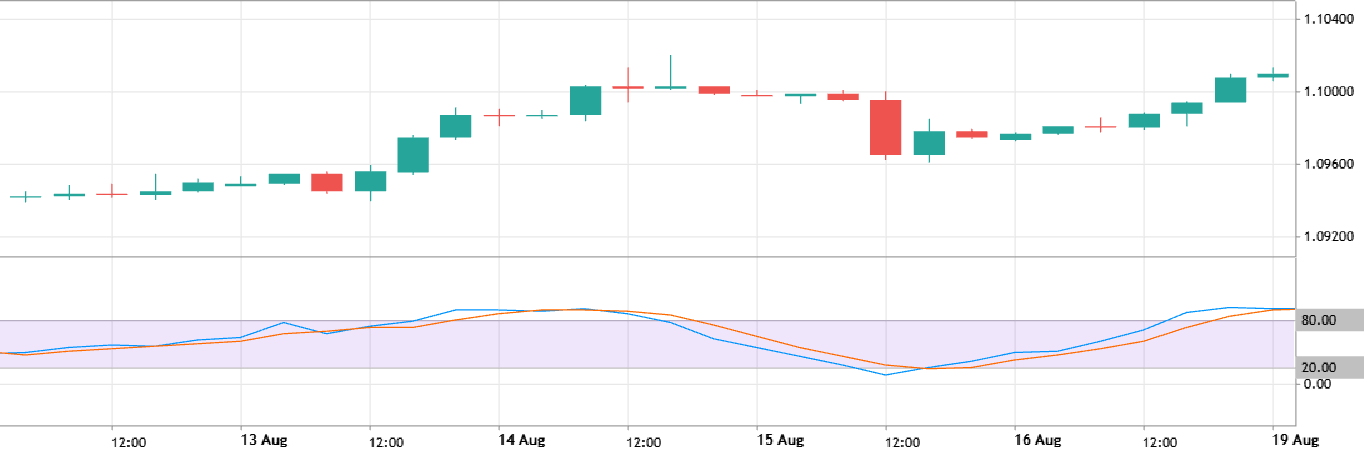
In this image, the indicator and the price are moving in sync, providing no signals for entering or exiting trades.
Divergence occurs when the price continues to follow the trend, but the indicator starts moving in the opposite direction. Before diving deeper, let’s clear up a few points:
- In the past, two terms “divergence” and “convergence” were commonly used. Divergence indicated a discrepancy where the price continued to rise, but the indicator began to fall. Convergence was the opposite scenario, where the price declined, and the indicator lines ascended. Nowadays, the term “convergence” is less frequently used. Traders primarily refer to bullish and bearish divergences.
- This article will illustrate examples of classic divergence. Other types, such as “hidden” and “extended” divergences, will be discussed in future articles.
How to Spot Classic Divergence
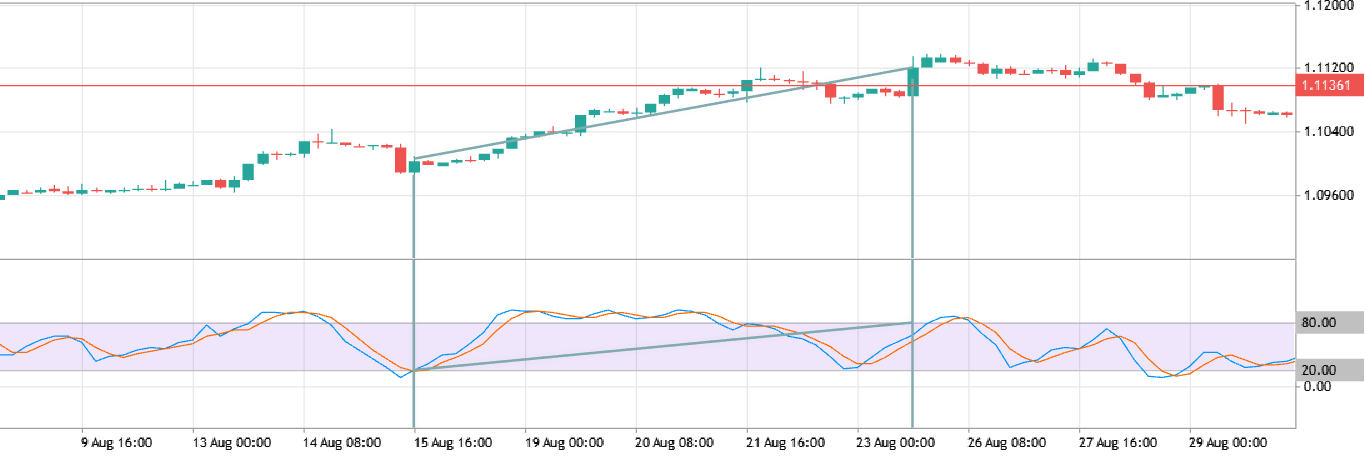
Now that we’ve clarified the terminology, let’s explore how to identify divergence on a chart. To identify divergence, you need to connect the highs and lows on both the price chart and the indicator. Stochastic and MACD are the most common tools for spotting divergence. Here’s an example where there is no divergence—notice how the sloping lines on both charts run parallel:
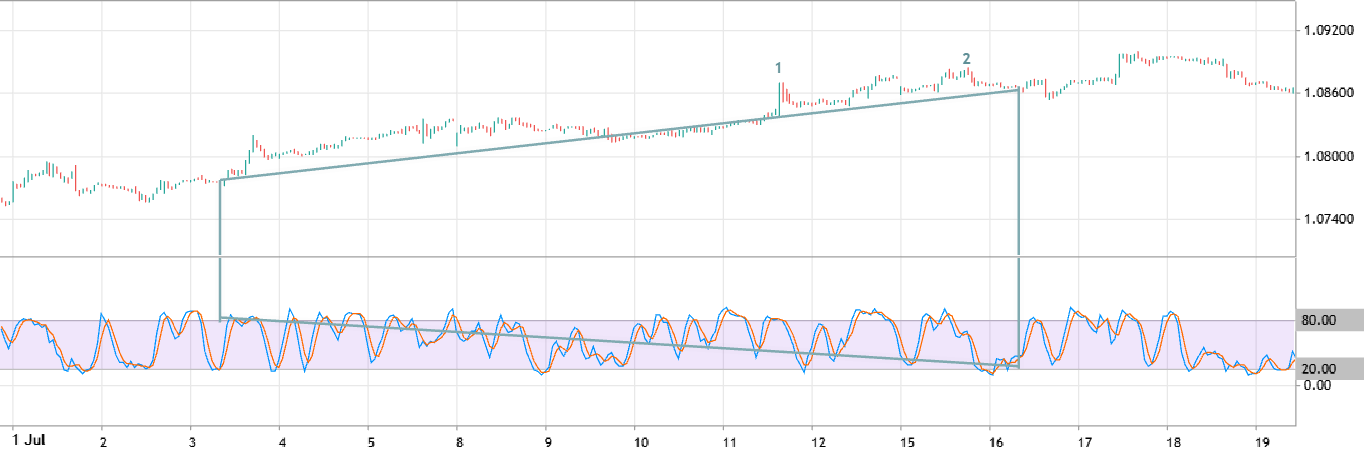
Now, take a look at this next chart:
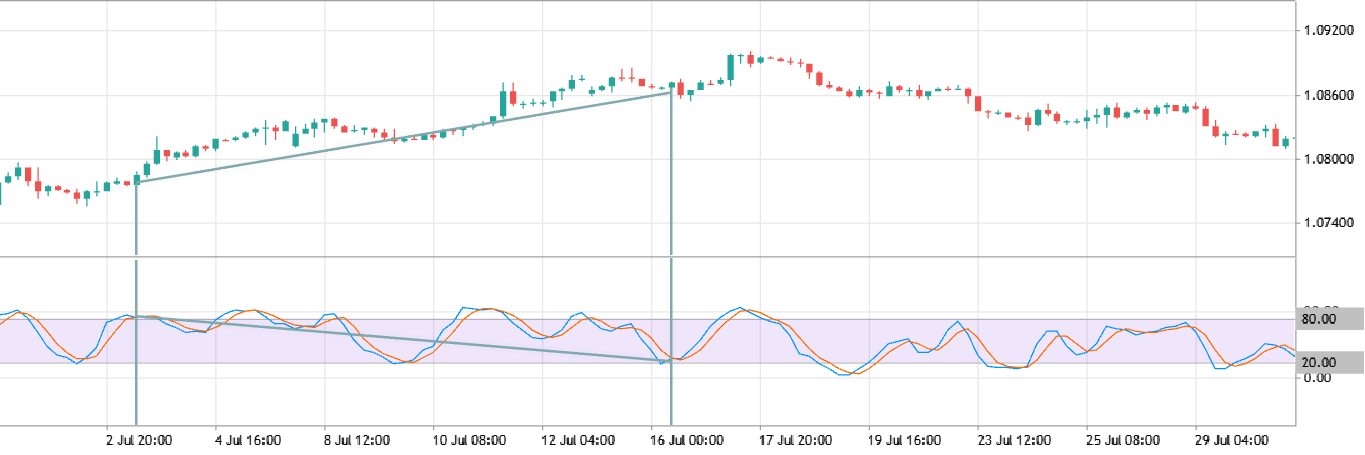
Here, you can clearly see a discrepancy between the price and the indicator. This is an example of bearish divergence, which, as shown on the chart, indicated a trend reversal. After a brief rise, the price moves downward. If the lines had moved in opposite directions, it would signal a bullish divergence.
Rules of Using Divergence in Trading
Now that you know how to spot divergence, let’s talk about how to use it in your trading:
- Divergence is not a standalone strategy. It’s just one tool that can signal a potential trend reversal. Before you rely on it, set clear rules for placing orders, entering trades, managing risk, and targeting profits.
- Trend reversal doesn’t always follow. The end of a trend could lead to a sideways or flat market, making it harder to predict where the price will go next. To improve your accuracy, use additional tools, such as trading volume data, and don’t ignore fundamental factors.
- Use multiple timeframes. Divergence tends to be more noticeable on larger timeframes. The examples we’ve used here are on the H4 (four-hour) timeframe, where trend changes are easier to spot. However, smaller timeframes like 1H (one-hour) can provide more precise information on the best time to open a trade. Here’s the same pattern, now shown on a 1H chart:
You can see that the upper-right corner of the pattern isn’t ideal for opening sell trades, unlike the candles marked with numbers.
Conclusion
Classic divergence is a common occurrence in the Forex market. By regularly using oscillators, you’ll quickly learn to spot divergence and use it to predict trend changes. Combine this with your knowledge of other technical analysis tools, and always follow solid risk management practices, like limiting trade sizes and setting stop orders. With practice, divergence can become a powerful tool in your trading strategy, giving you a real edge in the market.