
Among the numerous indicators employed by Forex traders, moving averages stand out for their simplicity and effectiveness. This visually intuitive tool offers traders a variety of opportunities, including identifying buy and sell signals, drawing support and resistance lines, spotting trend reversals, and more. Setting it up is straightforward – simply select the period and type of moving average.
In this article, we’ll not only explain how to configure the indicator but also explore a few strategies you can quickly and easily build based on it. Let’s see if it’s as straightforward as it appears.
Article content
What Are Moving Averages?
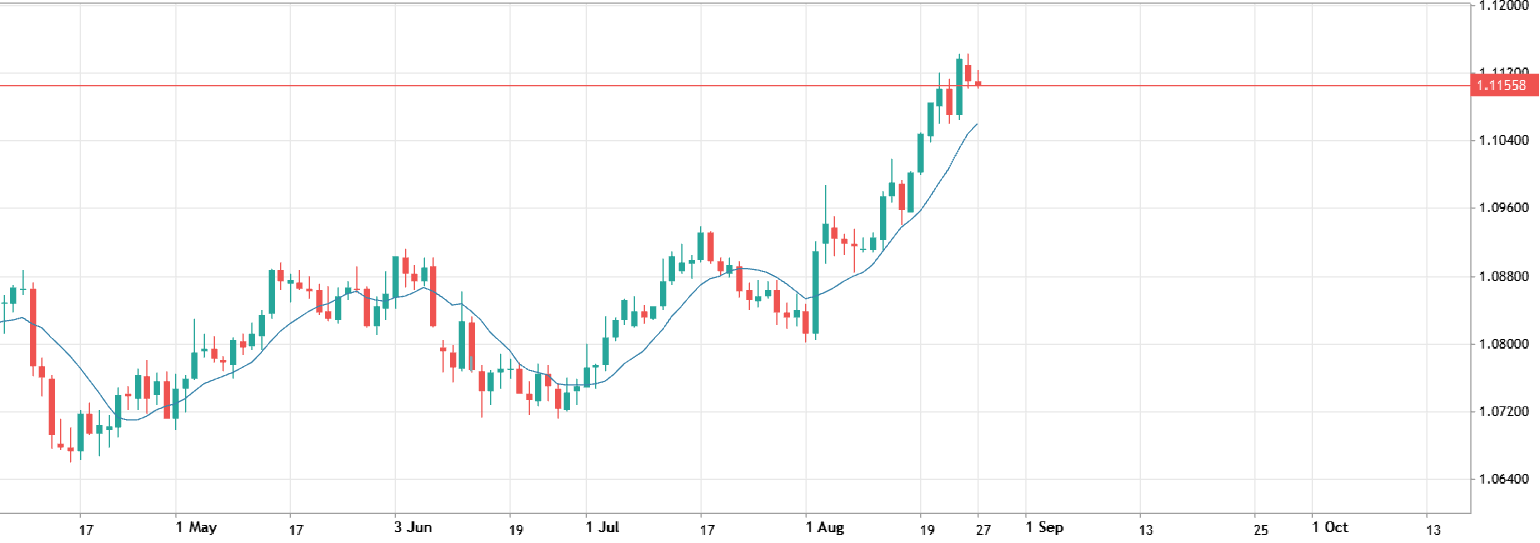
At its core, a moving average shows the average price of an asset over a chosen time period. On a chart, it appears as a smooth line that follows the general trend but with a slight delay. In this image, the moving average is represented by the blue line.
Setting Up Moving Averages
Setting up the moving average indicator is simple. In your trading platform, locate the “Moving Average” indicator. Upon opening it, you’ll see that the settings field is quite small.
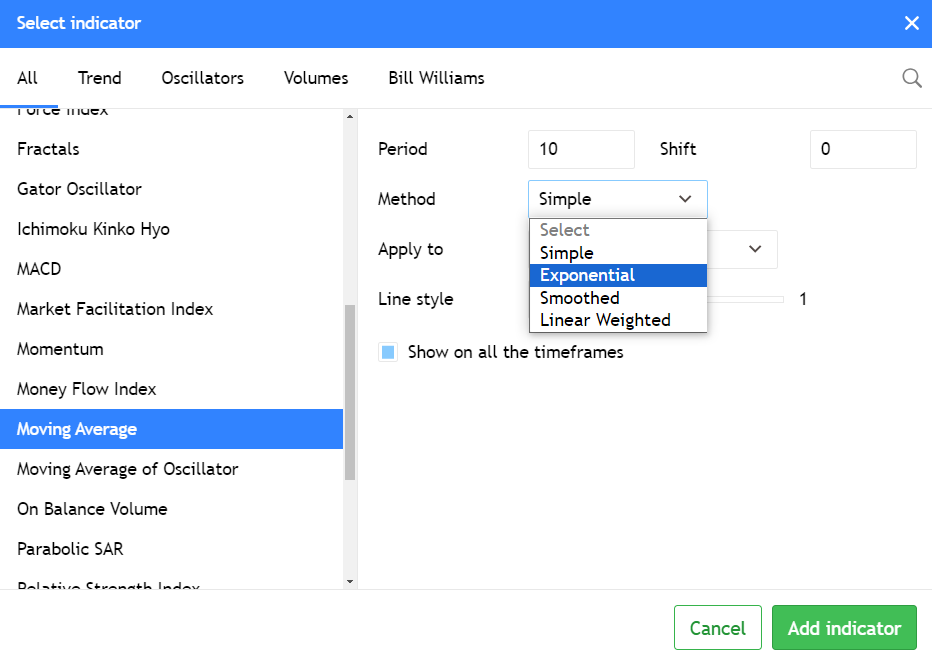
Two key settings to focus on are the period and the method. The period (typically set to 10 by default) represents the number of candles considered in the indicator’s formula. As for the method, the most commonly used are “simple” and “exponential.” The difference? In the simple method, all candles have equal weight in the calculation, while in the exponential method, more recent candles are given greater weight. This simplicity is one of the reasons for the indicator’s widespread use. Now that we understand how to set it up, let’s delve into some strategies.
Crossover
As you’ve already understood, the moving average can be longer or shorter depending on the period. One of the simplest and most understandable strategies is trading based on the crossover of moving averages with different lengths.
For example, let’s use two moving averages: one with a period of 10 (blue line) and the other with a period of 50 (red line) on a four-hour EUR/USD chart. By the way, here’s an important note – you set the specific period values yourself; there is no perfect formula.
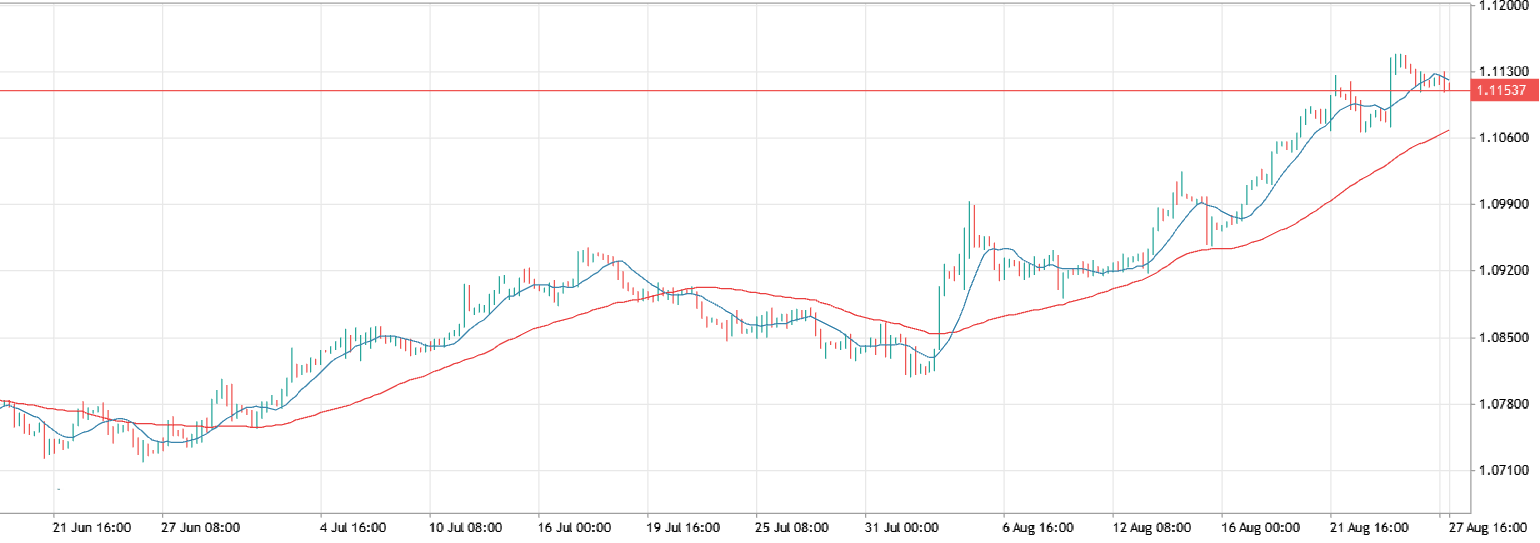
On this chart, you can see three crossover points of the indicator lines. It’s quite clear that a bullish signal occurs when the shorter period line crosses the other from bottom to top. And vice versa. The main problem with this strategy is that, firstly, the indicator lags behind the market, and secondly, there aren’t many signals. In this case, there were three signals over two months.
Ribbon
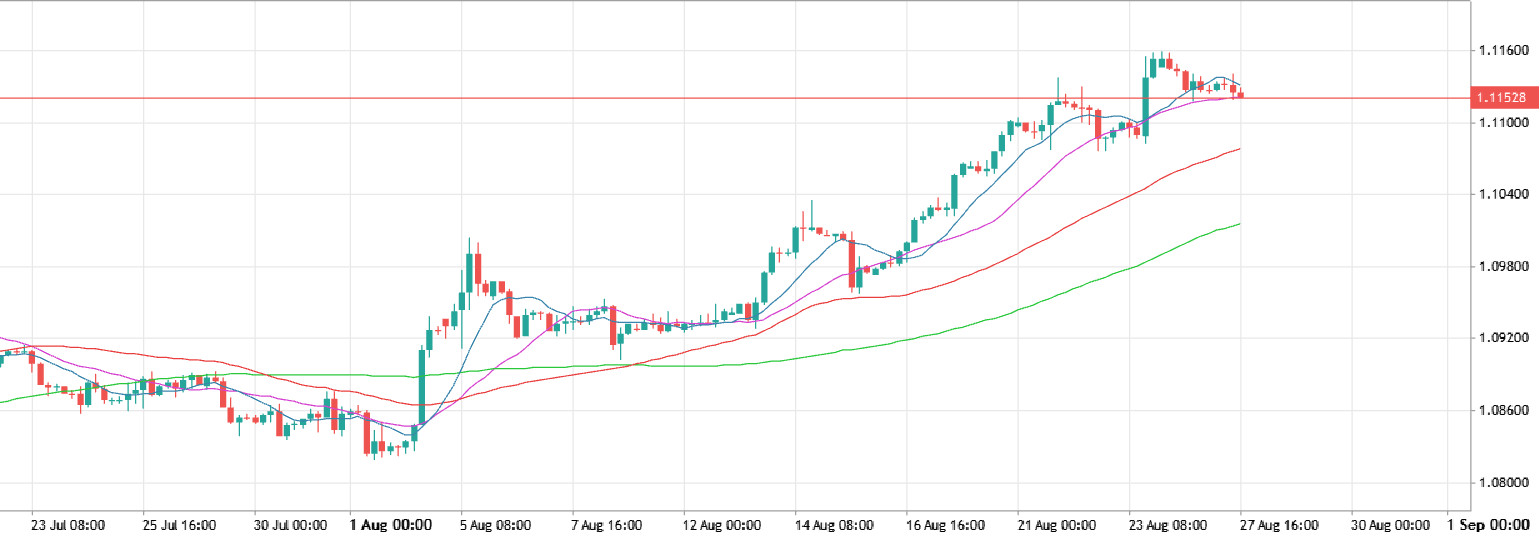
As you might guess, there’s no limit to the number of moving averages you can place on a chart. The “Ribbon” strategy involves creating between 4 and 8 indicators with different periods and observing their relationships. When the “ribbon” expands, it suggests a continuation of the current trend, while narrowing may indicate an approaching reversal or consolidation.
Envelope
For this approach, you’ll use the same moving average indicator but under the name “Envelopes.” Here’s what it looks like:
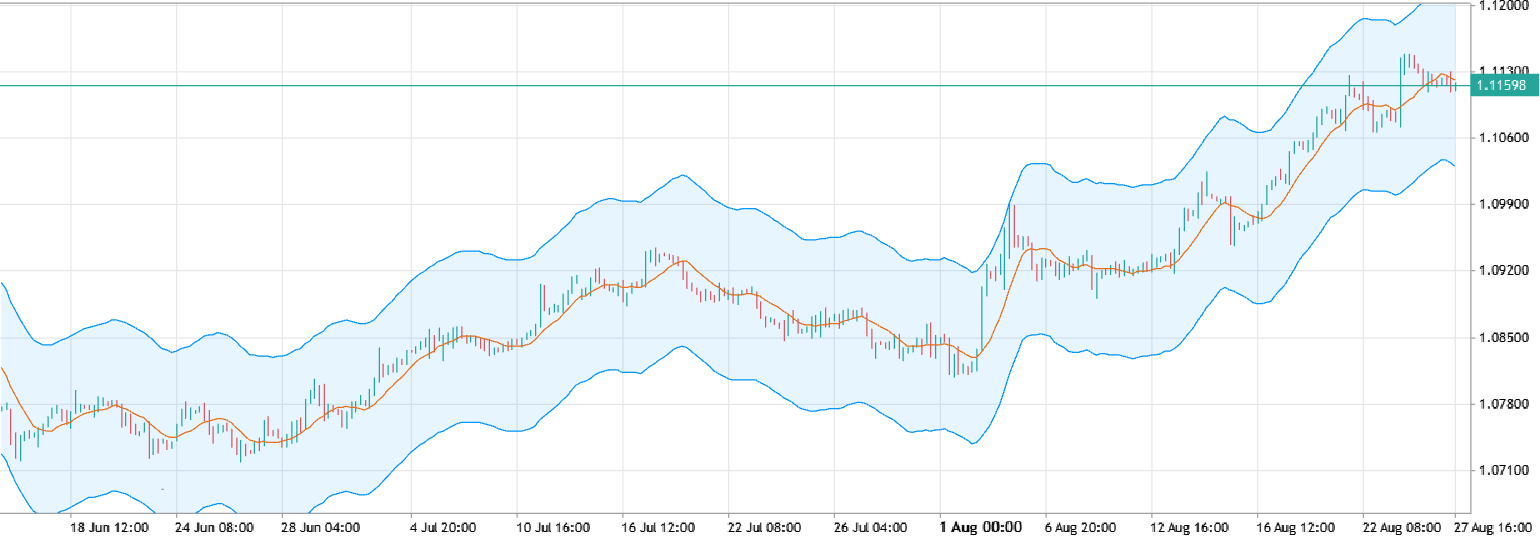
In this strategy, the upper and lower boundaries of the envelope act as support and resistance levels. When the price chart crosses these boundaries, it’s often seen as a sign of the asset being overbought or oversold. However, this strategy can be unreliable. For example, in the chart above, crossing the upper boundary rarely leads to significant pullbacks. Use the envelope strategy cautiously.
What Do These Strategies Have in Common?
The common thread among these strategies is their simplicity and clarity, making them accessible to traders of all levels. However, this simplicity also raises doubts about their standalone effectiveness. For beginner traders, we recommend using moving averages as a supplementary tool. When combined with indicators like MACD or Bollinger Bands, you can obtain more reliable entry and exit signals.
Keep in mind that moving averages are lagging indicators. If you closely examine the charts, you’ll notice that major news events can trigger long candles that form quickly, while moving averages take time to react. This delay could lead to receiving signals after a short-term trend has already run its course.
That said, moving averages are far from useless. They’ve been a staple tool for successful traders in Forex and other markets for decades. Experiment with different period settings, test on various timeframes, and combine with other indicators and market events. Moving averages can be a valuable addition to your technical analysis toolkit.