Technical analysis is a cornerstone of successful Forex trading strategies. Among the countless indicators available, the Moving Average Convergence Divergence (MACD) is a standout favorite among traders worldwide. In this article, we’ll break down how it works and why it’s a valuable tool for making trading decisions.
Article content
Understanding the MACD Indicator
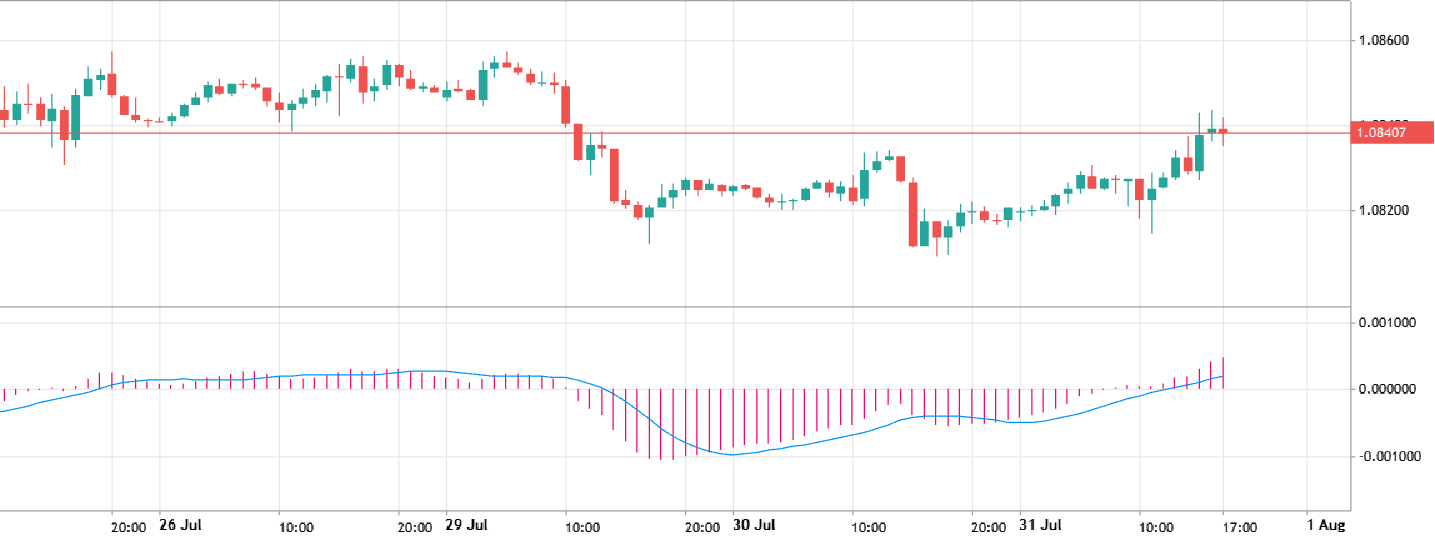
Let’s start with the basics. Here is how the MACD looks on the EUR/USD chart on the H1 timeframe:
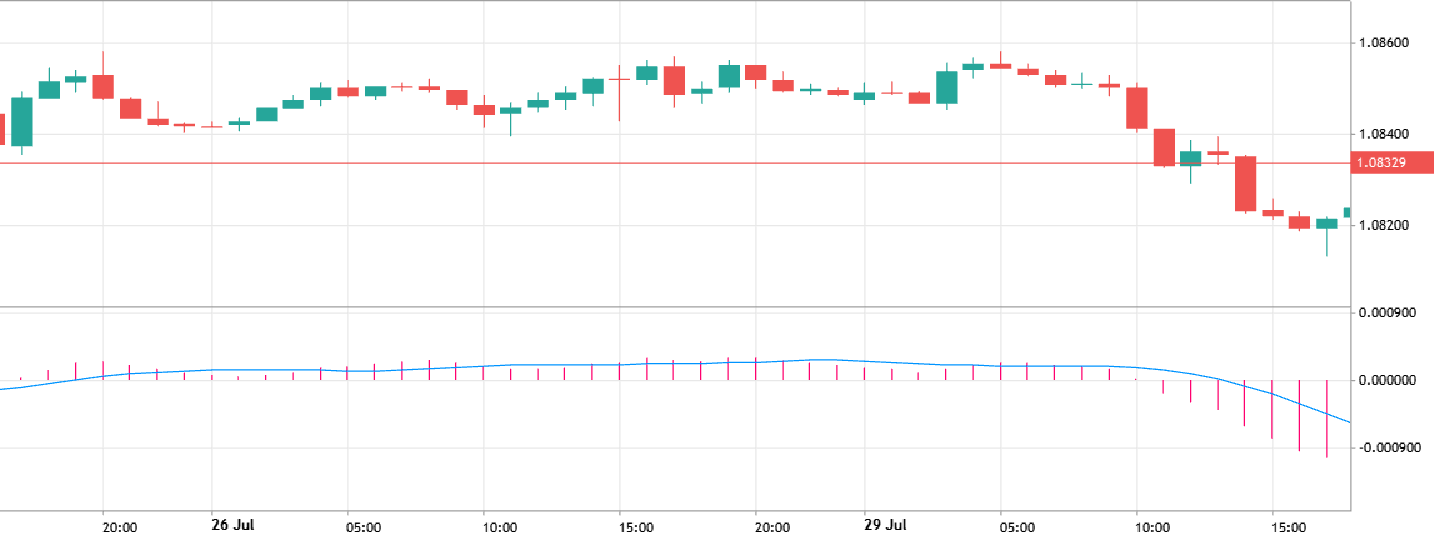
The MACD appears as a simple combination of a histogram and a line. These elements are derived from comparing two moving averages with different timeframes. Essentially, the histogram (those bars) shows how much these averages are diverging. The taller the bars, the stronger the market movement. Conversely, in a sideways market, the histogram will be flat:
As you might expect, the bars will be above the zero line during an uptrend and below it during a downtrend. The line accompanying the histogram is also a moving average, but calculated differently. It’s based on the histogram itself and acts as a support or resistance level for the indicator.
MACD Settings
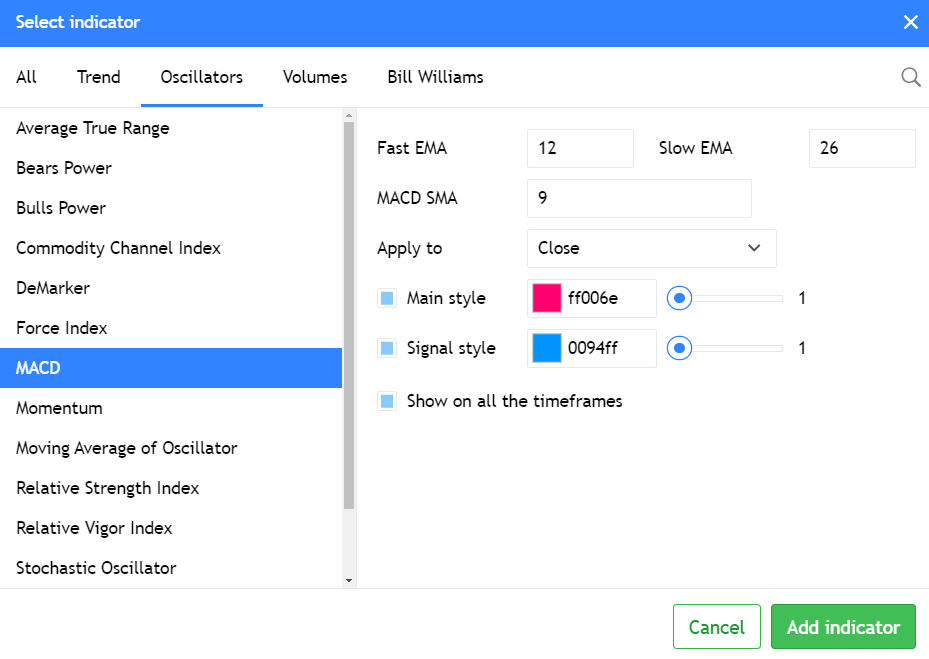
The MACD is a standard indicator, so you won’t need to install anything extra. You can find it in the ‘Oscillators’ tab of your trading platform.
The two moving averages used in the MACD are typically referred to as the Fast and Slow Exponential Moving Averages (EMA). The standard settings for these are 12, 26, and 9. Since the histogram is based on the difference between the two moving averages, it’s clear that a large gap between them will result in tall histogram bars. While adjusting the MACD settings can create unique trading strategies, this article will focus on the standard parameters used by most traders.
Crossover Strategy
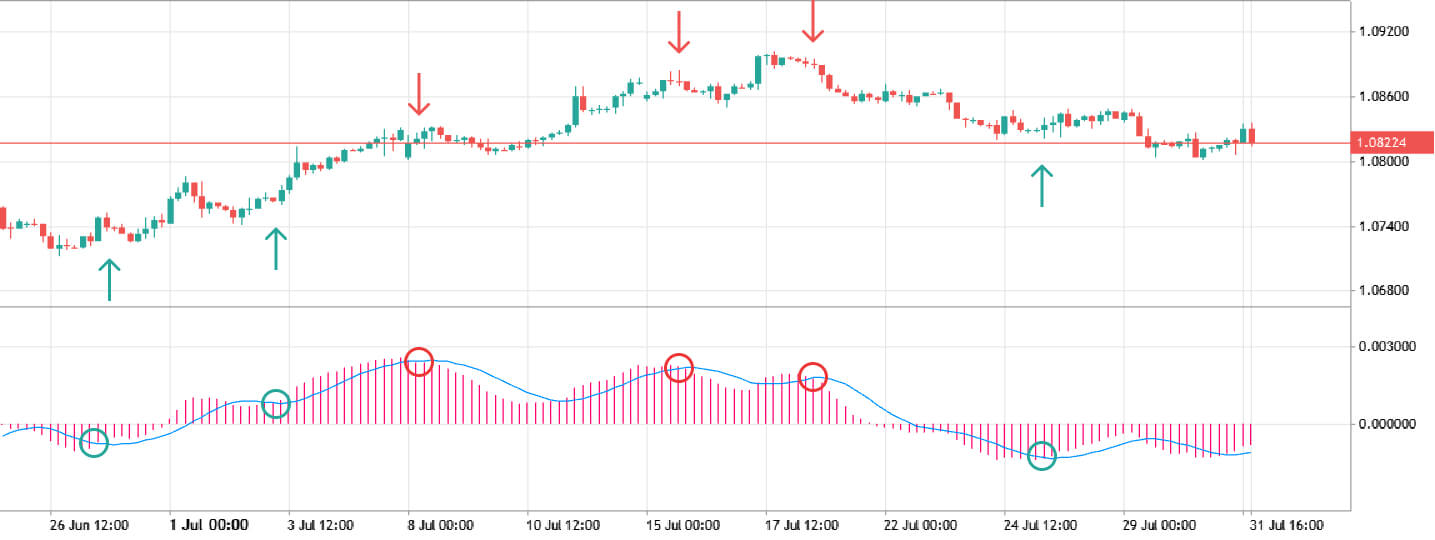
The crossover strategy is incredibly simple, which likely explains MACD’s widespread popularity. This indicator can reliably identify potential trade entry points. Look at the chart below.
Green circles mark buy signals, while red circles indicate sell signals. A buy signal occurs when the histogram crosses the indicator line from bottom to top. Conversely, a sell signal happens when the histogram crosses the line from top to bottom.
We intentionally chose a relatively flat chart to demonstrate the MACD’s effectiveness in low-volatility conditions. Despite the market’s lack of strong trends, the indicator generated 4-5 correct signals out of 6, a commendable performance.
Divergence
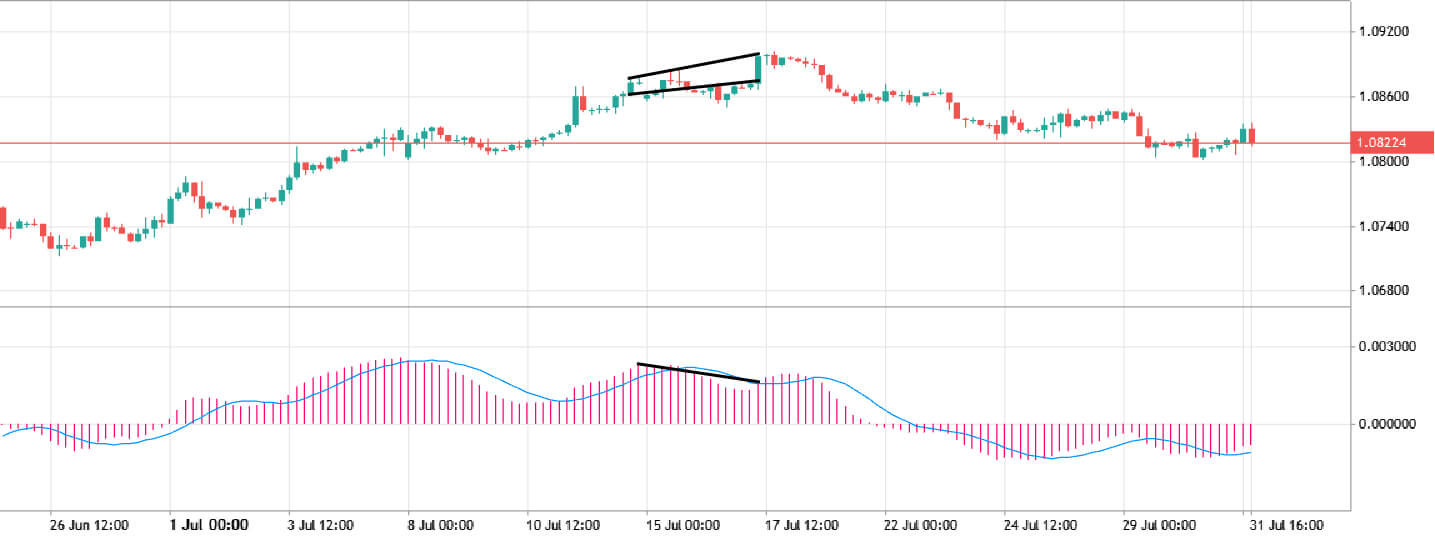
Remember, the MACD is an oscillator. Oscillators are often used to identify divergences, which are inconsistencies between price movement and indicator behavior. Essentially, if the price and the indicator move in opposite directions, it could signal a potential trend reversal.
Look at the chart above again. You’ll notice a clear divergence. To identify divergence, follow these steps:
- Connect two price peaks or troughs.
- Connect the corresponding peaks or troughs on the histogram.
- Compare the direction of these lines.
If the lines move in opposite directions, it suggests a potential trend exhaustion. However, it’s crucial to remember that divergence alone isn’t a definitive sell signal. A confirmed sell signal occurs when the price breaks below a support level or trendline. Interestingly, both charts in this article display a nearly simultaneous sell signal.
Histogram Reversal
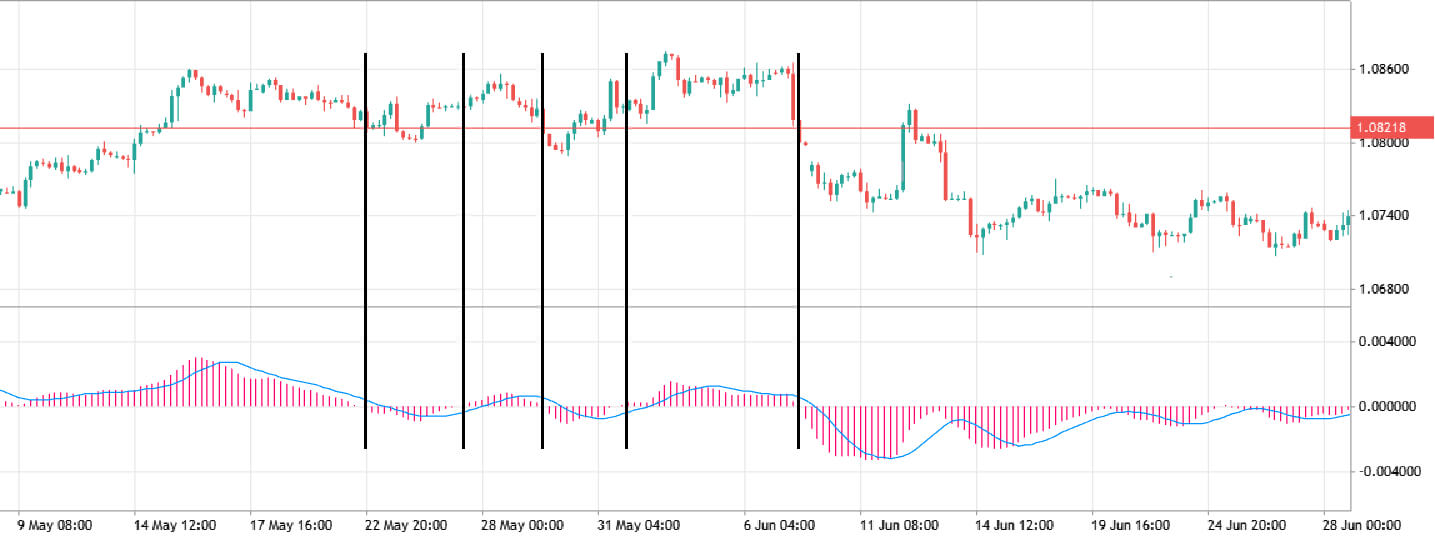
Some traders believe that a simple reversal of the histogram can be a trading signal. However, we caution against relying solely on this indicator. While the histogram’s position above or below zero does reflect the overall market trend, crossing the zero line doesn’t always guarantee a trend change, even in the short term.
As shown in the image, the market can experience periods of sideways movement, leading to false signals if you base your trades solely on histogram reversals. Additionally, the histogram often crosses the zero line after the actual trend change has already occurred. In contrast, the crossover signals we discussed earlier provide more timely indications of potential trade entries.
Conclusion
While there are numerous advanced strategies involving the MACD, often combined with indicators like the Relative Strength Index (RSI) and Moving Averages, our focus has been on the most basic and effective methods. It’s essential to remember that even the clearest signals require risk management. Always use stop-loss and take-profit orders to protect your capital and build a sustainable trading strategy.


